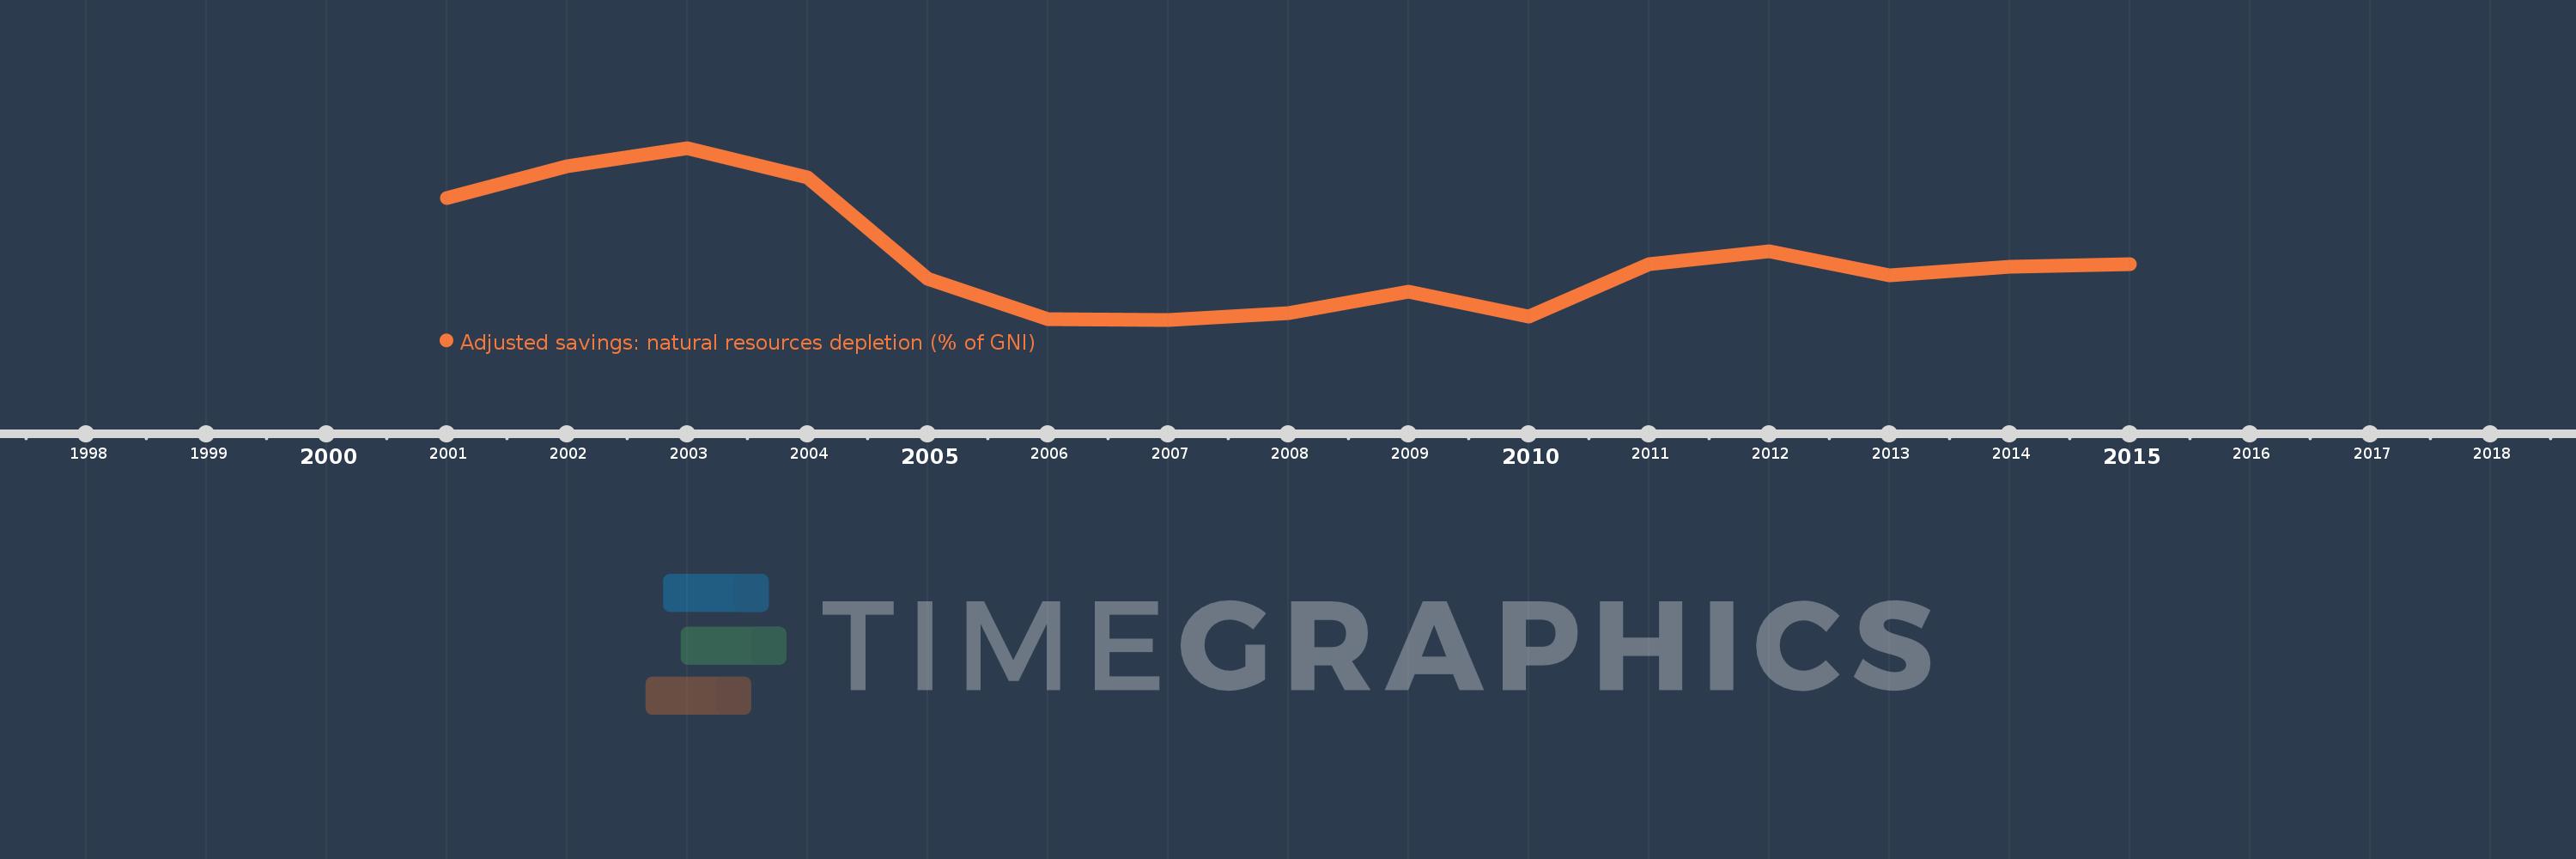
This timeline shows a graph from 2001 to 2015 of Estonia. No data until 2000. Number of actual observations by date: 15.
Source name:
World Development Indicators
Source organization:
World Bank staff estimates based on sources and methods in World Bank's "The Changing Wealth of Nations: Measuring Sustainable Development in the New Millennium" (2011).
Categories, topics:
Economy & Growth, Energy & Mining
Last updated:
apr 23, 2017
Indicators value changes by year
Meaning:
0.939
Minimum:
0.182
jan 1, 2007
Maximum:
2.247
jan 1, 2003
At the date of observation
Value
Absolute change
Change from the previous value
jan 1, 2001
1.648
+1.648
0.0%
jan 1, 2002
2.032
+0.384
23.28%
jan 1, 2003
2.247
+0.215
10.58%
jan 1, 2004
1.893
-0.354
-15.75%
jan 1, 2005
0.672
-1.221
-64.49%
jan 1, 2006
0.185
-0.487
-72.42%
jan 1, 2007
0.182
-0.003
-1.64%
jan 1, 2008
0.258
+0.076
41.71%
jan 1, 2009
0.516
+0.258
99.84%
jan 1, 2010
0.22
-0.297
-57.48%
jan 1, 2011
0.847
+0.627
285.58%
jan 1, 2012
1.0
+0.153
18.09%
jan 1, 2013
0.716
-0.284
-28.38%
jan 1, 2014
0.822
+0.105
14.73%
jan 1, 2015
0.85
+0.028
3.43%
Ranking of countries by current statistics by years