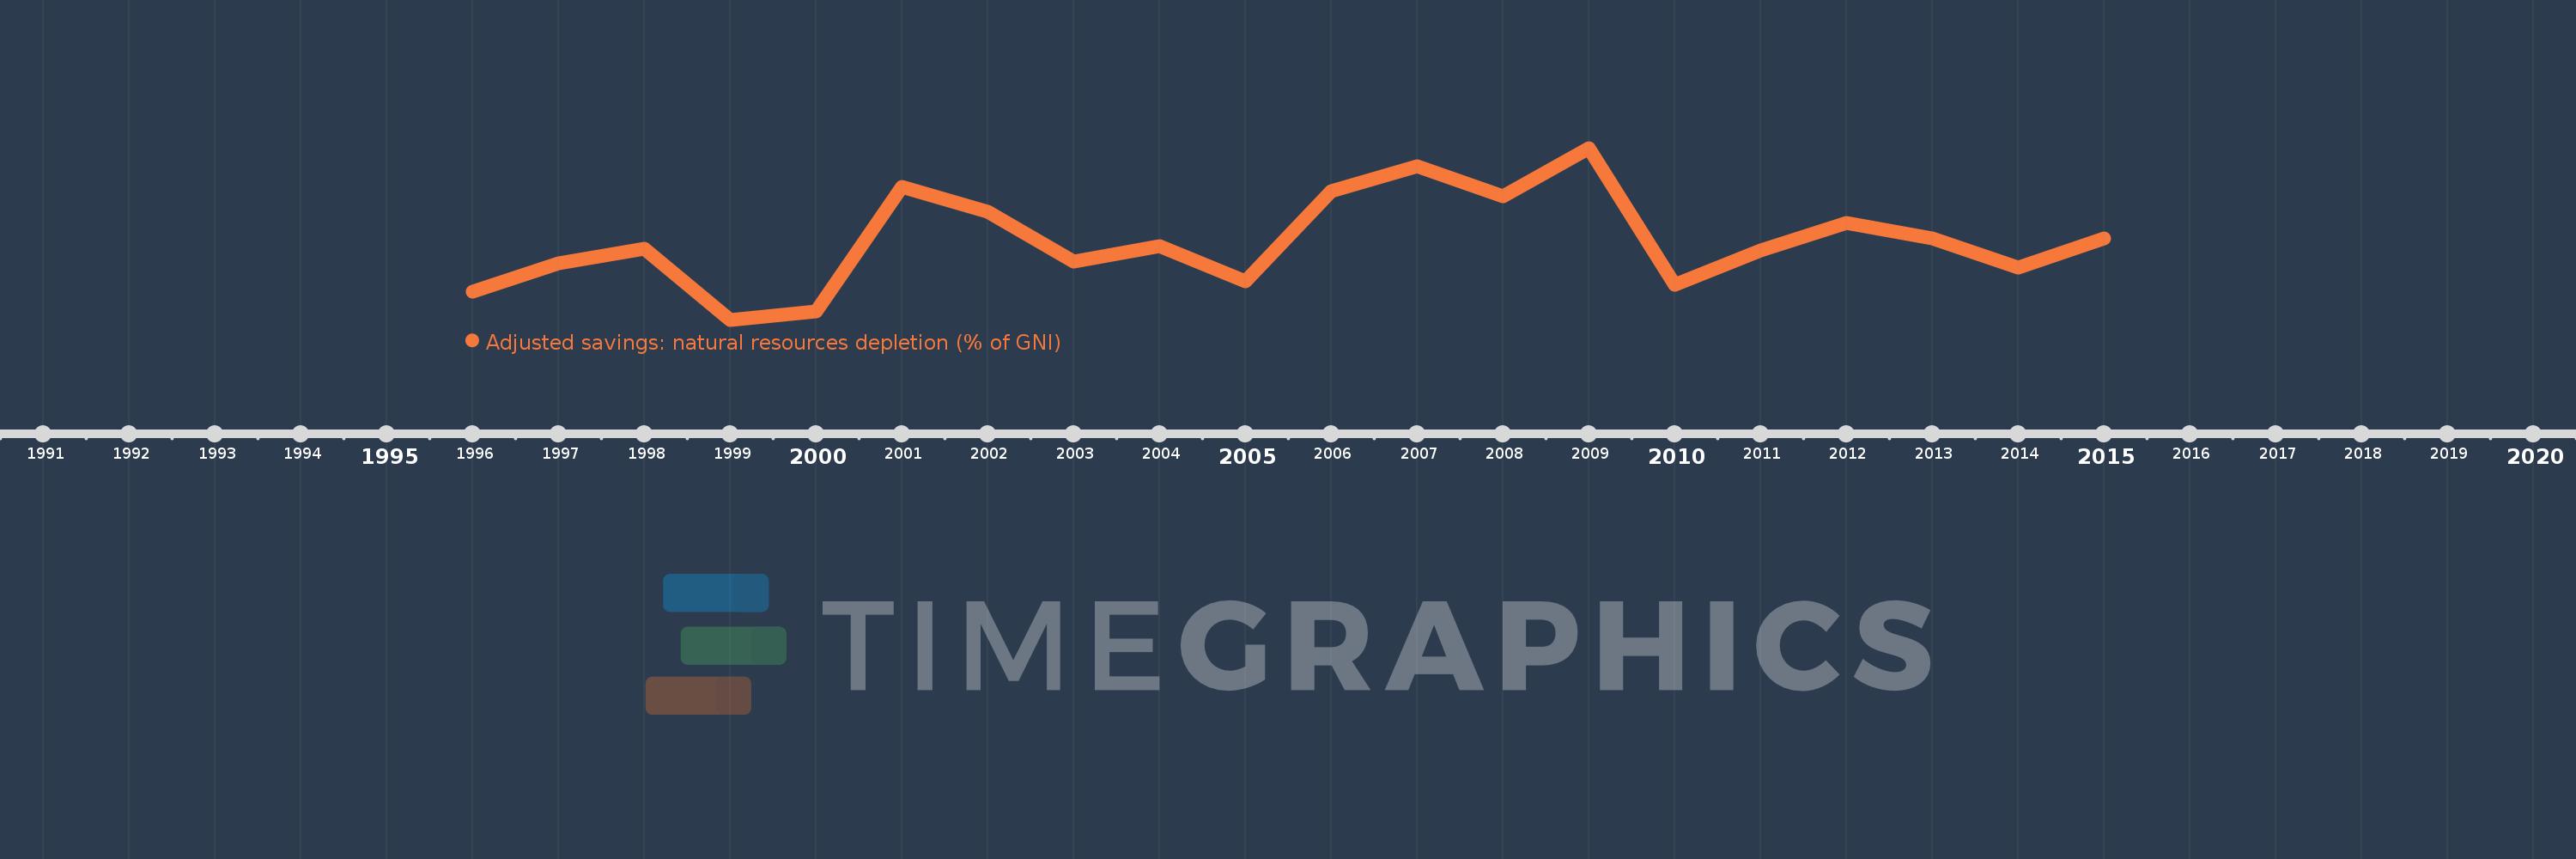
This timeline shows a graph from 1996 to 2015 of Croatia. No data until 1995. Number of actual observations by date: 20.
Source name:
World Development Indicators
Source organization:
World Bank staff estimates based on sources and methods in World Bank's "The Changing Wealth of Nations: Measuring Sustainable Development in the New Millennium" (2011).
Categories, topics:
Economy & Growth, Energy & Mining
Last updated:
apr 23, 2017
Indicators value changes by year
Meaning:
1.552
Minimum:
1.12
jan 1, 1999
Maximum:
2.066
jan 1, 2009
At the date of observation
Value
Absolute change
Change from the previous value
jan 1, 1996
1.273
+1.273
0.0%
jan 1, 1997
1.431
+0.157
12.35%
jan 1, 1998
1.509
+0.078
5.48%
jan 1, 1999
1.12
-0.389
-25.78%
jan 1, 2000
1.164
+0.044
3.97%
jan 1, 2001
1.851
+0.687
58.99%
jan 1, 2002
1.715
-0.136
-7.37%
jan 1, 2003
1.441
-0.274
-15.98%
jan 1, 2004
1.524
+0.083
5.79%
jan 1, 2005
1.333
-0.191
-12.53%
jan 1, 2006
1.829
+0.496
37.21%
jan 1, 2007
1.967
+0.138
7.52%
jan 1, 2008
1.798
-0.169
-8.59%
jan 1, 2009
2.066
+0.268
14.9%
jan 1, 2010
1.312
-0.754
-36.49%
jan 1, 2011
1.503
+0.191
14.56%
jan 1, 2012
1.651
+0.148
9.86%
jan 1, 2013
1.569
-0.082
-4.95%
jan 1, 2014
1.405
-0.164
-10.46%
jan 1, 2015
1.568
+0.162
11.55%
Ranking of countries by current statistics by years