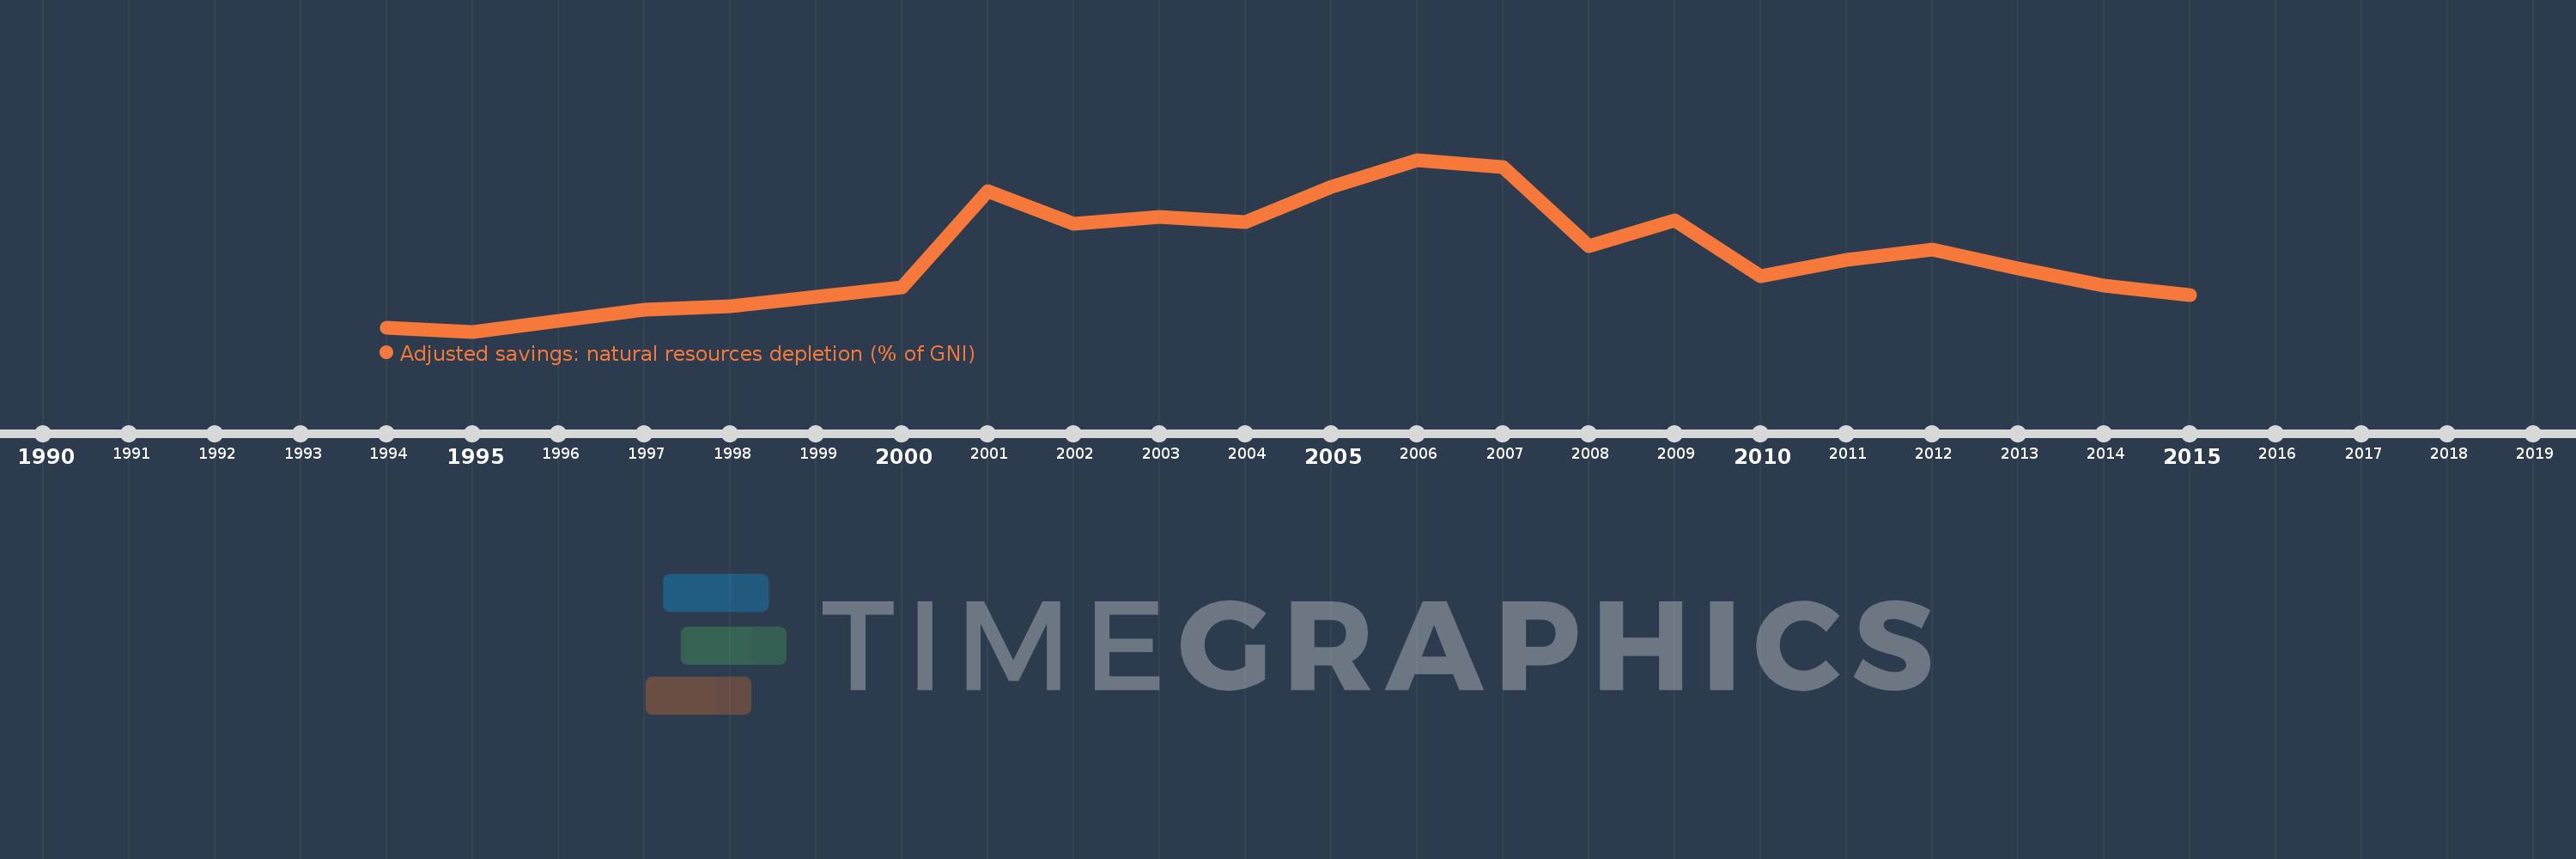
This timeline shows a graph from 1994 to 2015 of Kazakhstan. No data until 1993. Number of actual observations by date: 21.
Source name:
World Development Indicators
Source organization:
World Bank staff estimates based on sources and methods in World Bank's "The Changing Wealth of Nations: Measuring Sustainable Development in the New Millennium" (2011).
Categories, topics:
Economy & Growth, Energy & Mining
Last updated:
apr 23, 2017
Indicators value changes by year
Meaning:
20.493
Minimum:
7.733
jan 1, 1995
Maximum:
36.294
jan 1, 2006
At the date of observation
Value
Absolute change
Change from the previous value
jan 1, 1994
8.444
+8.444
0.0%
jan 1, 1995
7.733
-0.71
-8.41%
jan 1, 1996
9.459
+1.726
22.32%
jan 1, 1997
11.383
+1.924
20.34%
jan 1, 1998
11.913
+0.53
4.65%
jan 1, 2000
15.127
+3.213
26.97%
jan 1, 2001
31.074
+15.947
105.42%
jan 1, 2002
25.587
-5.486
-17.66%
jan 1, 2003
26.86
+1.273
4.98%
jan 1, 2004
25.983
-0.877
-3.26%
jan 1, 2005
31.754
+5.77
22.21%
jan 1, 2006
36.294
+4.541
14.3%
jan 1, 2007
35.13
-1.164
-3.21%
jan 1, 2008
21.988
-13.141
-37.41%
jan 1, 2009
26.212
+4.224
19.21%
jan 1, 2010
16.99
-9.222
-35.18%
jan 1, 2011
19.704
+2.714
15.98%
jan 1, 2012
21.356
+1.651
8.38%
jan 1, 2013
18.201
-3.155
-14.77%
jan 1, 2014
15.425
-2.776
-15.25%
jan 1, 2015
13.742
-1.682
-10.91%
Ranking of countries by current statistics by years