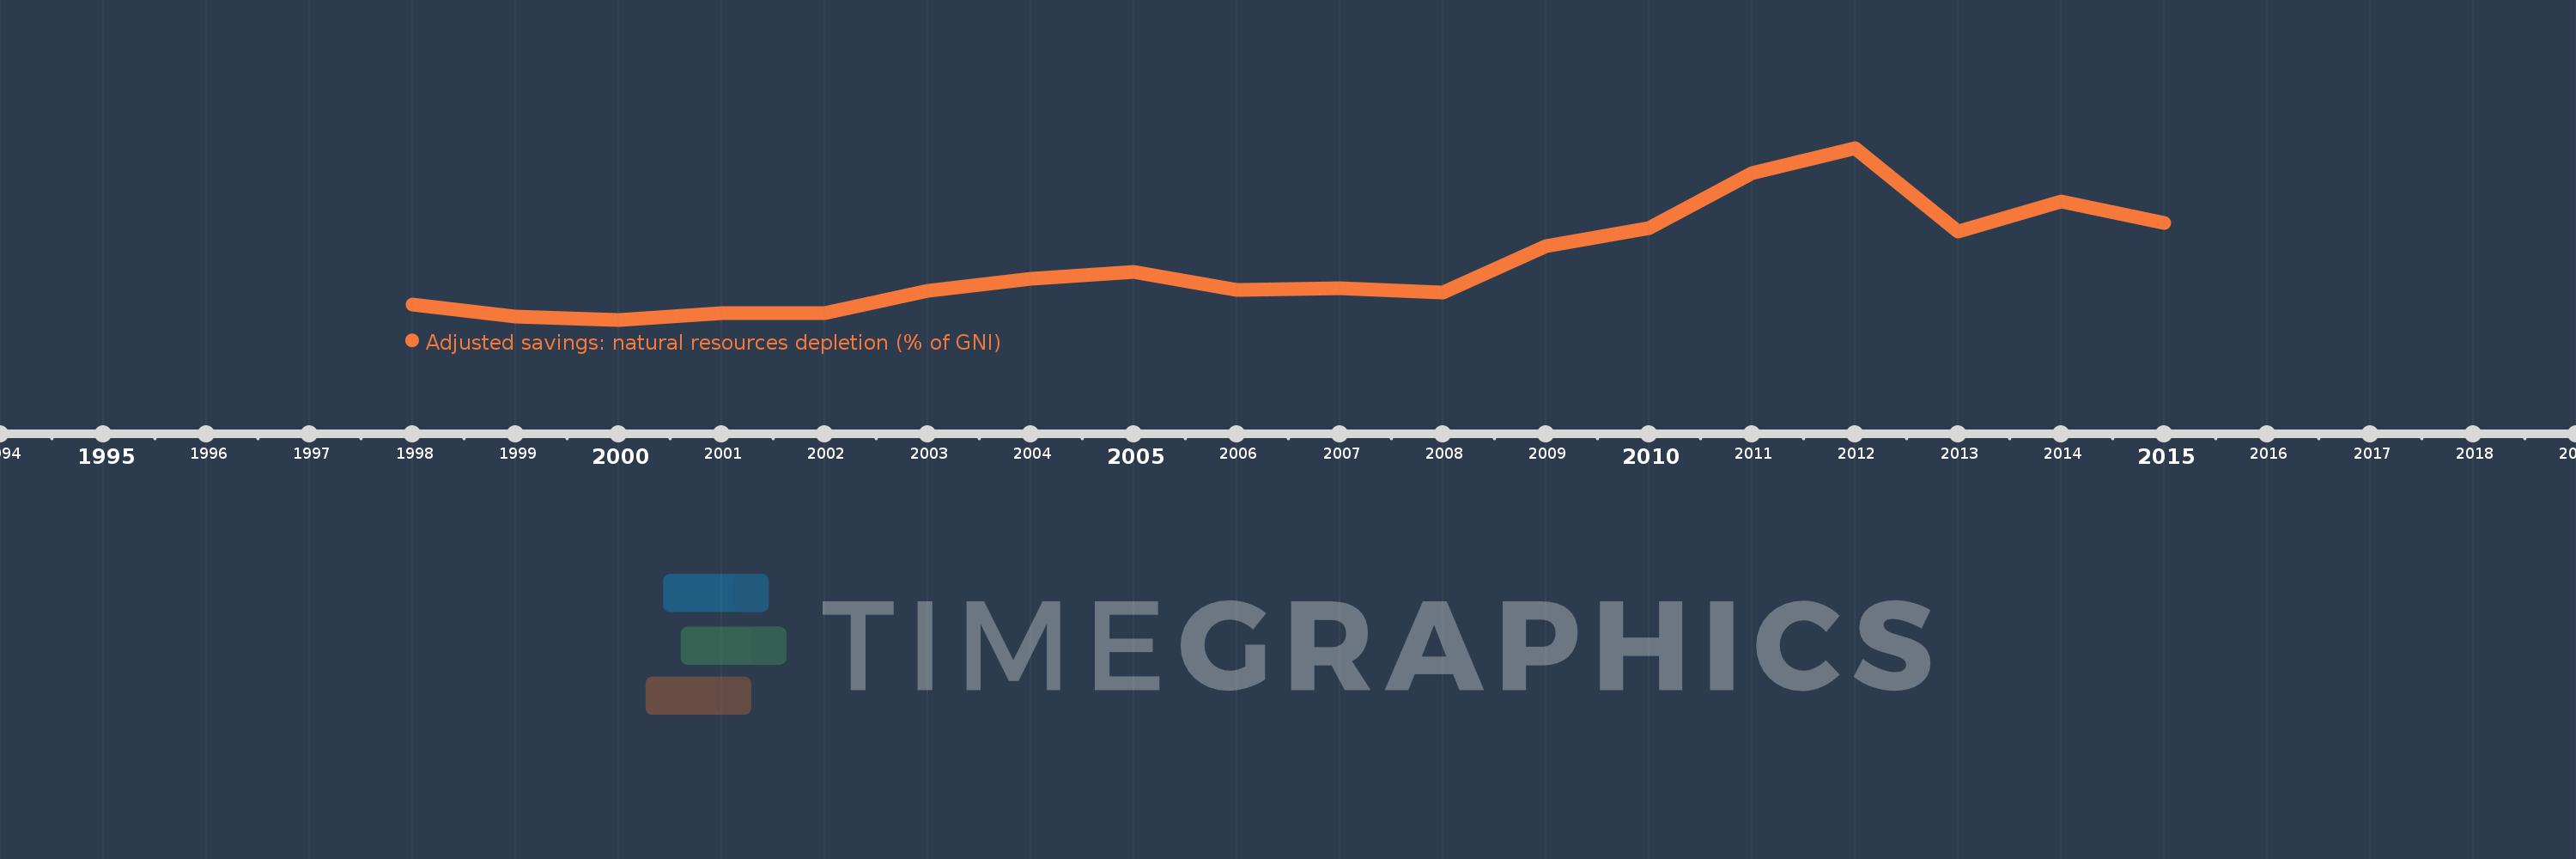
This timeline shows a graph from 1998 to 2015 of Kyrgyz Republic. No data until 1997. Number of actual observations by date: 18.
Source name:
World Development Indicators
Source organization:
World Bank staff estimates based on sources and methods in World Bank's "The Changing Wealth of Nations: Measuring Sustainable Development in the New Millennium" (2011).
Categories, topics:
Economy & Growth, Energy & Mining
Last updated:
apr 23, 2017
Indicators value changes by year
Meaning:
3.699
Minimum:
0.322
jan 1, 2000
Maximum:
10.505
jan 1, 2012
At the date of observation
Value
Absolute change
Change from the previous value
jan 1, 1998
1.226
+1.226
0.0%
jan 1, 1999
0.532
-0.694
-56.6%
jan 1, 2000
0.322
-0.21
-39.47%
jan 1, 2001
0.739
+0.417
129.49%
jan 1, 2002
0.697
-0.042
-5.73%
jan 1, 2003
2.028
+1.331
191.11%
jan 1, 2004
2.768
+0.74
36.51%
jan 1, 2005
3.176
+0.408
14.75%
jan 1, 2006
2.067
-1.109
-34.91%
jan 1, 2007
2.188
+0.121
5.83%
jan 1, 2008
1.942
-0.246
-11.26%
jan 1, 2009
4.662
+2.721
140.12%
jan 1, 2010
5.764
+1.101
23.63%
jan 1, 2011
9.02
+3.256
56.49%
jan 1, 2012
10.505
+1.485
16.46%
jan 1, 2013
5.561
-4.944
-47.06%
jan 1, 2014
7.333
+1.772
31.87%
jan 1, 2015
6.052
-1.282
-17.48%
Ranking of countries by current statistics by years