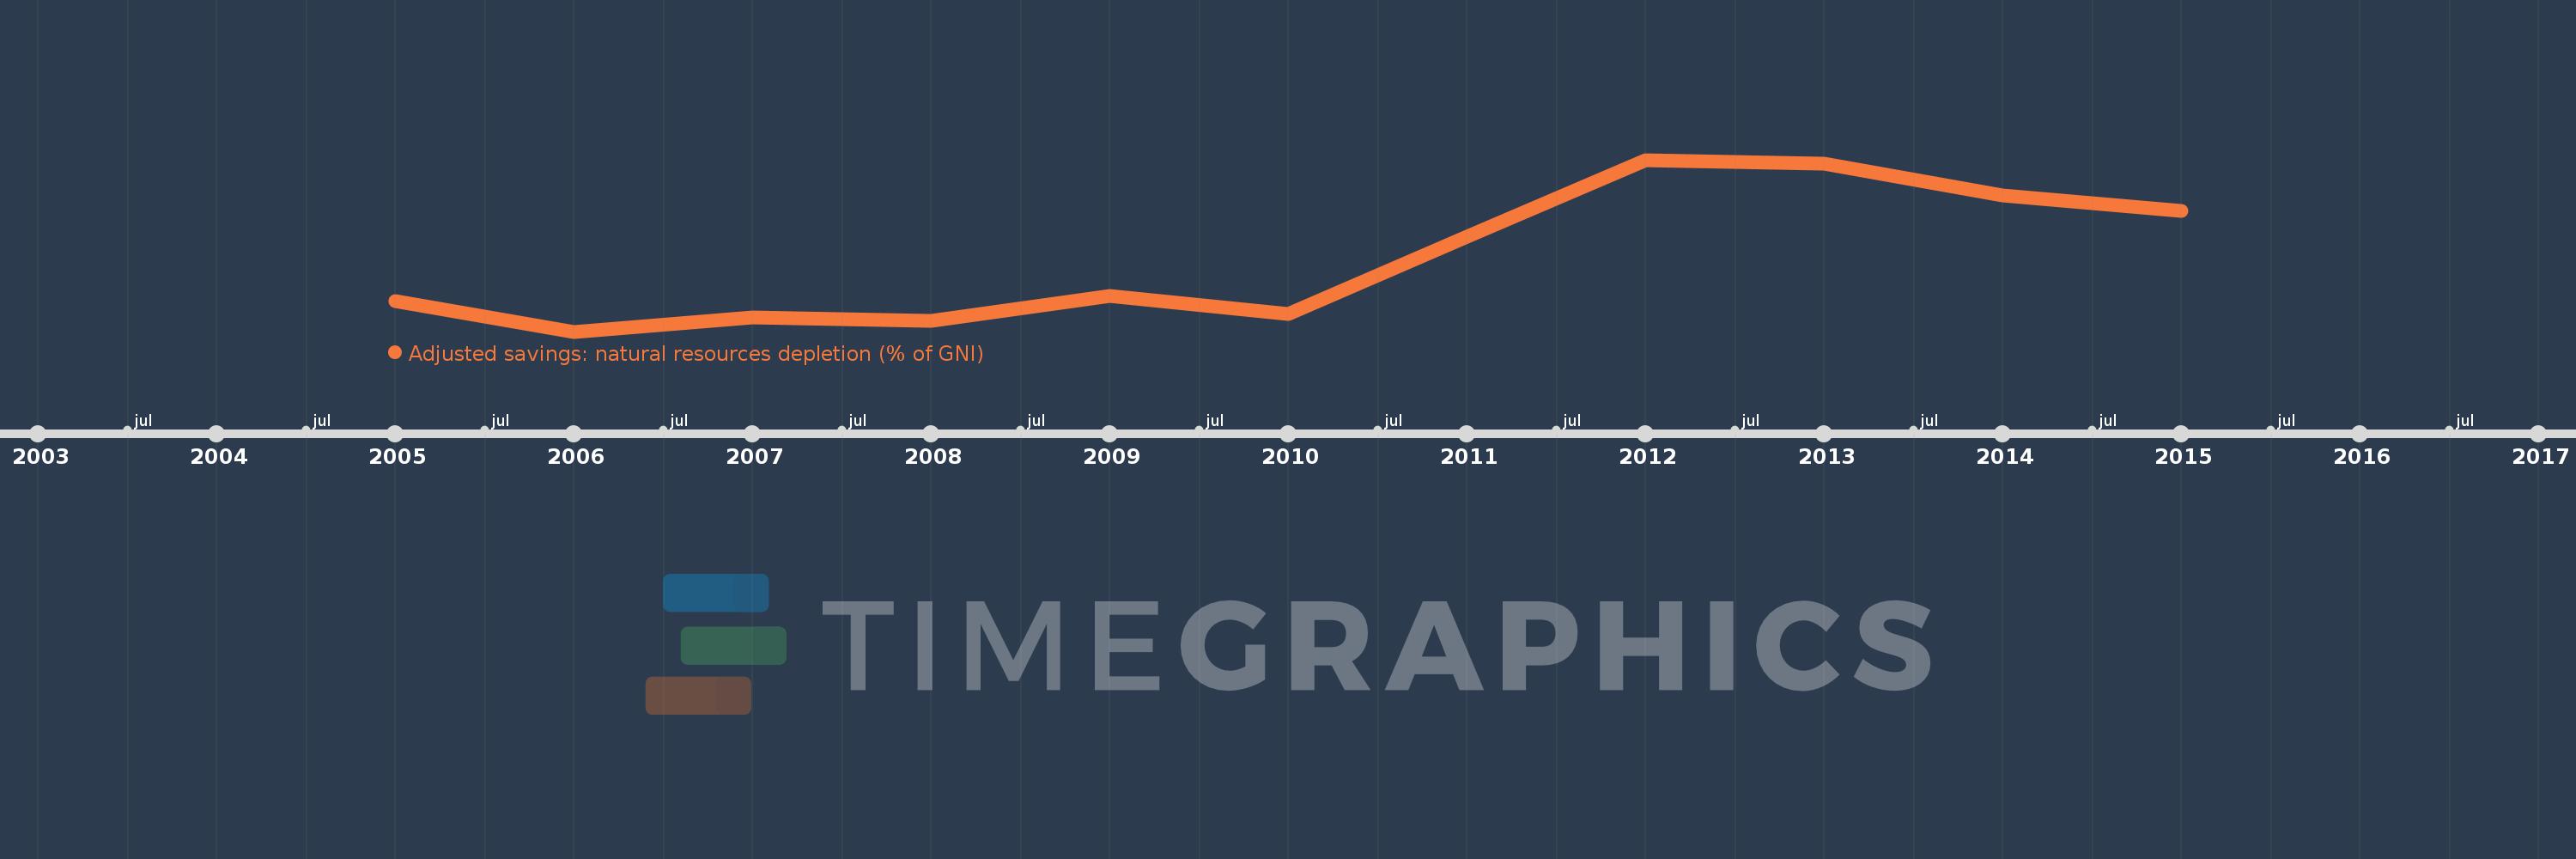
This timeline shows a graph from 2005 to 2015 of Tajikistan. No data until 2004. Number of actual observations by date: 11.
Source name:
World Development Indicators
Source organization:
World Bank staff estimates based on sources and methods in World Bank's "The Changing Wealth of Nations: Measuring Sustainable Development in the New Millennium" (2011).
Categories, topics:
Economy & Growth, Energy & Mining
Last updated:
apr 23, 2017
Indicators value changes by year
Meaning:
0.875
Minimum:
0.519
jan 1, 2006
Maximum:
1.36
jan 1, 2012
At the date of observation
Value
Absolute change
Change from the previous value
jan 1, 2005
0.669
+0.669
0.0%
jan 1, 2006
0.519
-0.151
-22.5%
jan 1, 2007
0.587
+0.069
13.22%
jan 1, 2008
0.573
-0.014
-2.34%
jan 1, 2009
0.695
+0.122
21.23%
jan 1, 2010
0.605
-0.09
-13.01%
jan 1, 2011
0.985
+0.381
62.93%
jan 1, 2012
1.36
+0.375
38.04%
jan 1, 2013
1.34
-0.02
-1.48%
jan 1, 2014
1.185
-0.155
-11.56%
jan 1, 2015
1.109
-0.076
-6.41%
Ranking of countries by current statistics by years