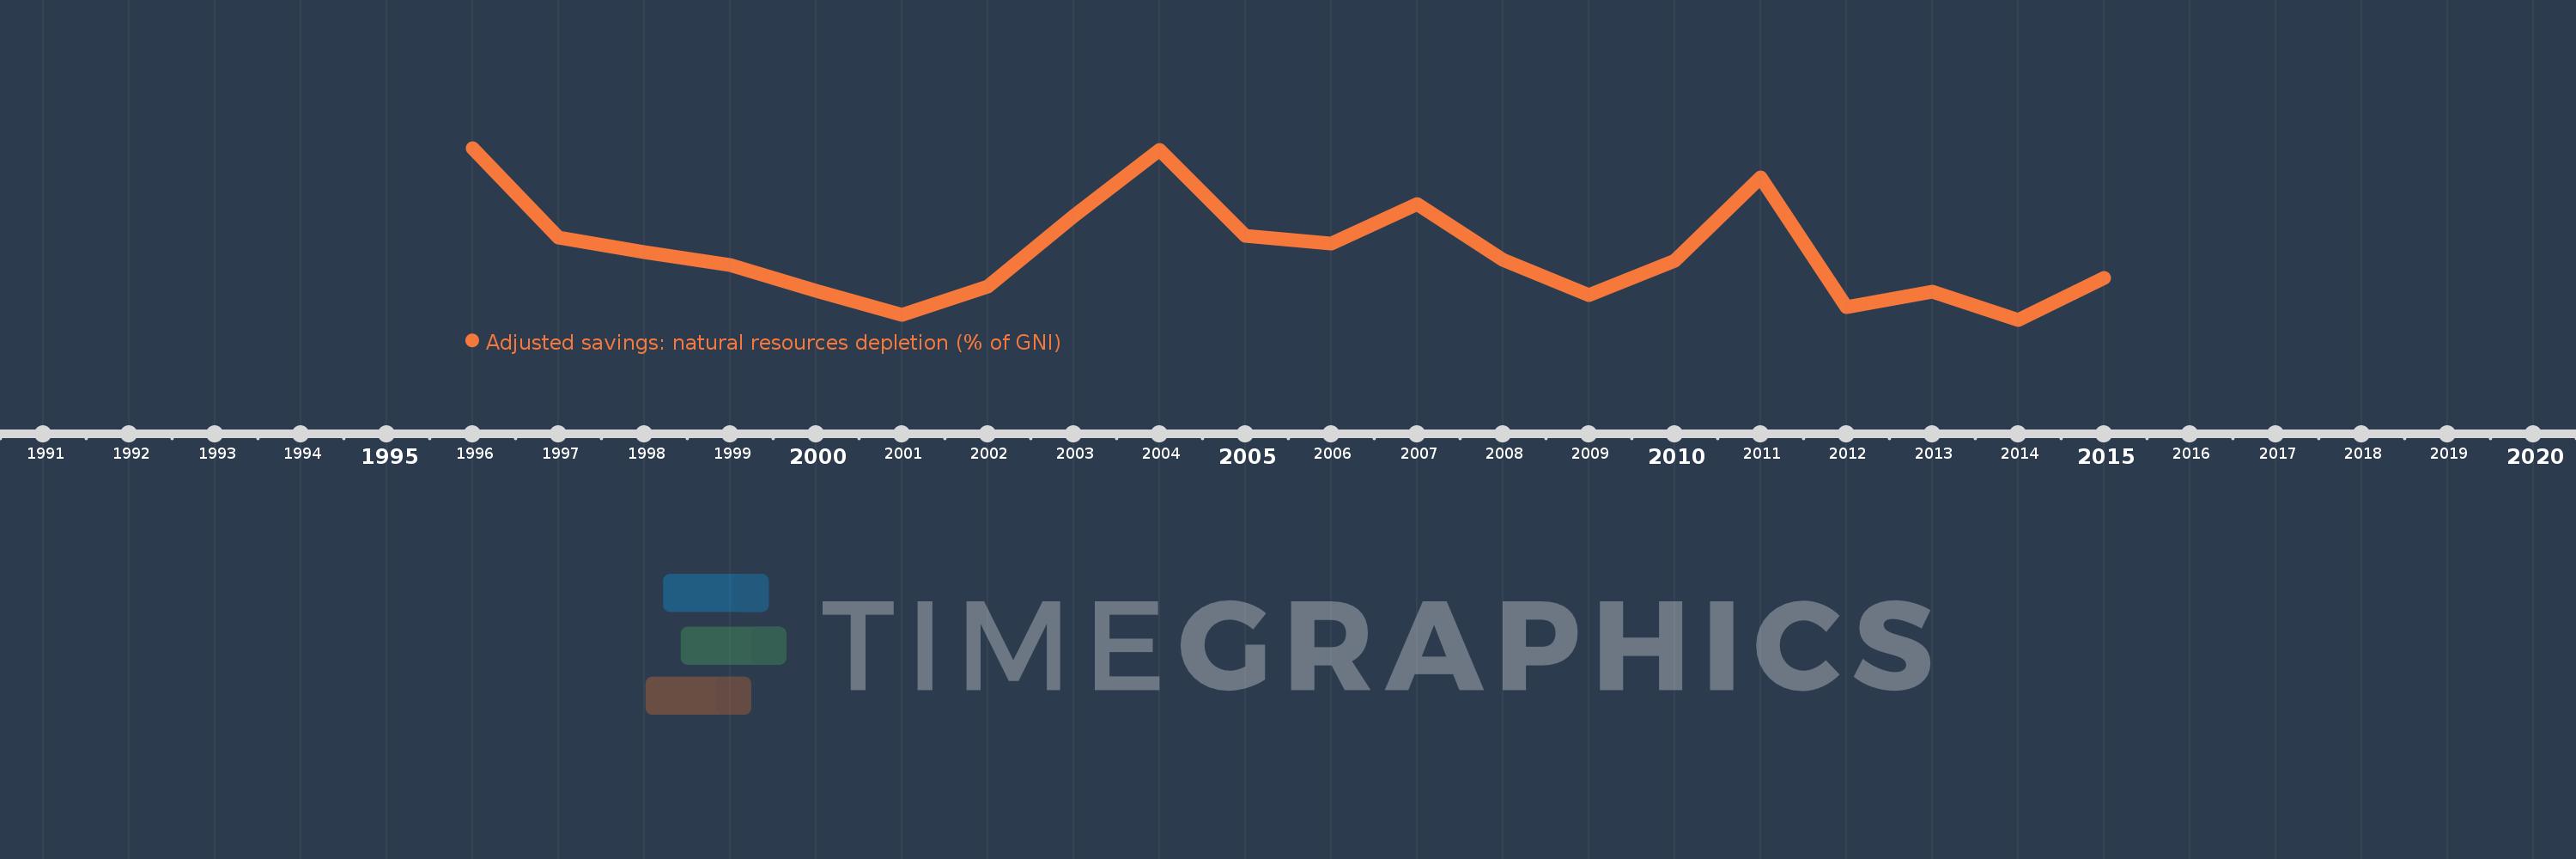
This timeline shows a graph from 1996 to 2015 of Paraguay. No data until 1995. Number of actual observations by date: 20.
Source name:
World Development Indicators
Source organization:
World Bank staff estimates based on sources and methods in World Bank's "The Changing Wealth of Nations: Measuring Sustainable Development in the New Millennium" (2011).
Categories, topics:
Economy & Growth, Energy & Mining
Last updated:
apr 23, 2017
Indicators value changes by year
Meaning:
5.791
Minimum:
4.47
jan 1, 2014
Maximum:
7.803
jan 1, 1996
At the date of observation
Value
Absolute change
Change from the previous value
jan 1, 1996
7.803
+7.803
0.0%
jan 1, 1997
6.069
-1.735
-22.23%
jan 1, 1998
5.788
-0.281
-4.63%
jan 1, 1999
5.532
-0.256
-4.42%
jan 1, 2000
5.028
-0.504
-9.11%
jan 1, 2001
4.569
-0.46
-9.14%
jan 1, 2002
5.115
+0.546
11.95%
jan 1, 2003
6.486
+1.371
26.81%
jan 1, 2004
7.763
+1.277
19.69%
jan 1, 2005
6.092
-1.671
-21.52%
jan 1, 2006
5.947
-0.145
-2.38%
jan 1, 2007
6.722
+0.775
13.03%
jan 1, 2008
5.638
-1.084
-16.13%
jan 1, 2009
4.949
-0.689
-12.21%
jan 1, 2010
5.623
+0.674
13.62%
jan 1, 2011
7.225
+1.601
28.48%
jan 1, 2012
4.716
-2.508
-34.72%
jan 1, 2013
5.013
+0.296
6.29%
jan 1, 2014
4.47
-0.543
-10.82%
jan 1, 2015
5.276
+0.806
18.02%
Ranking of countries by current statistics by years