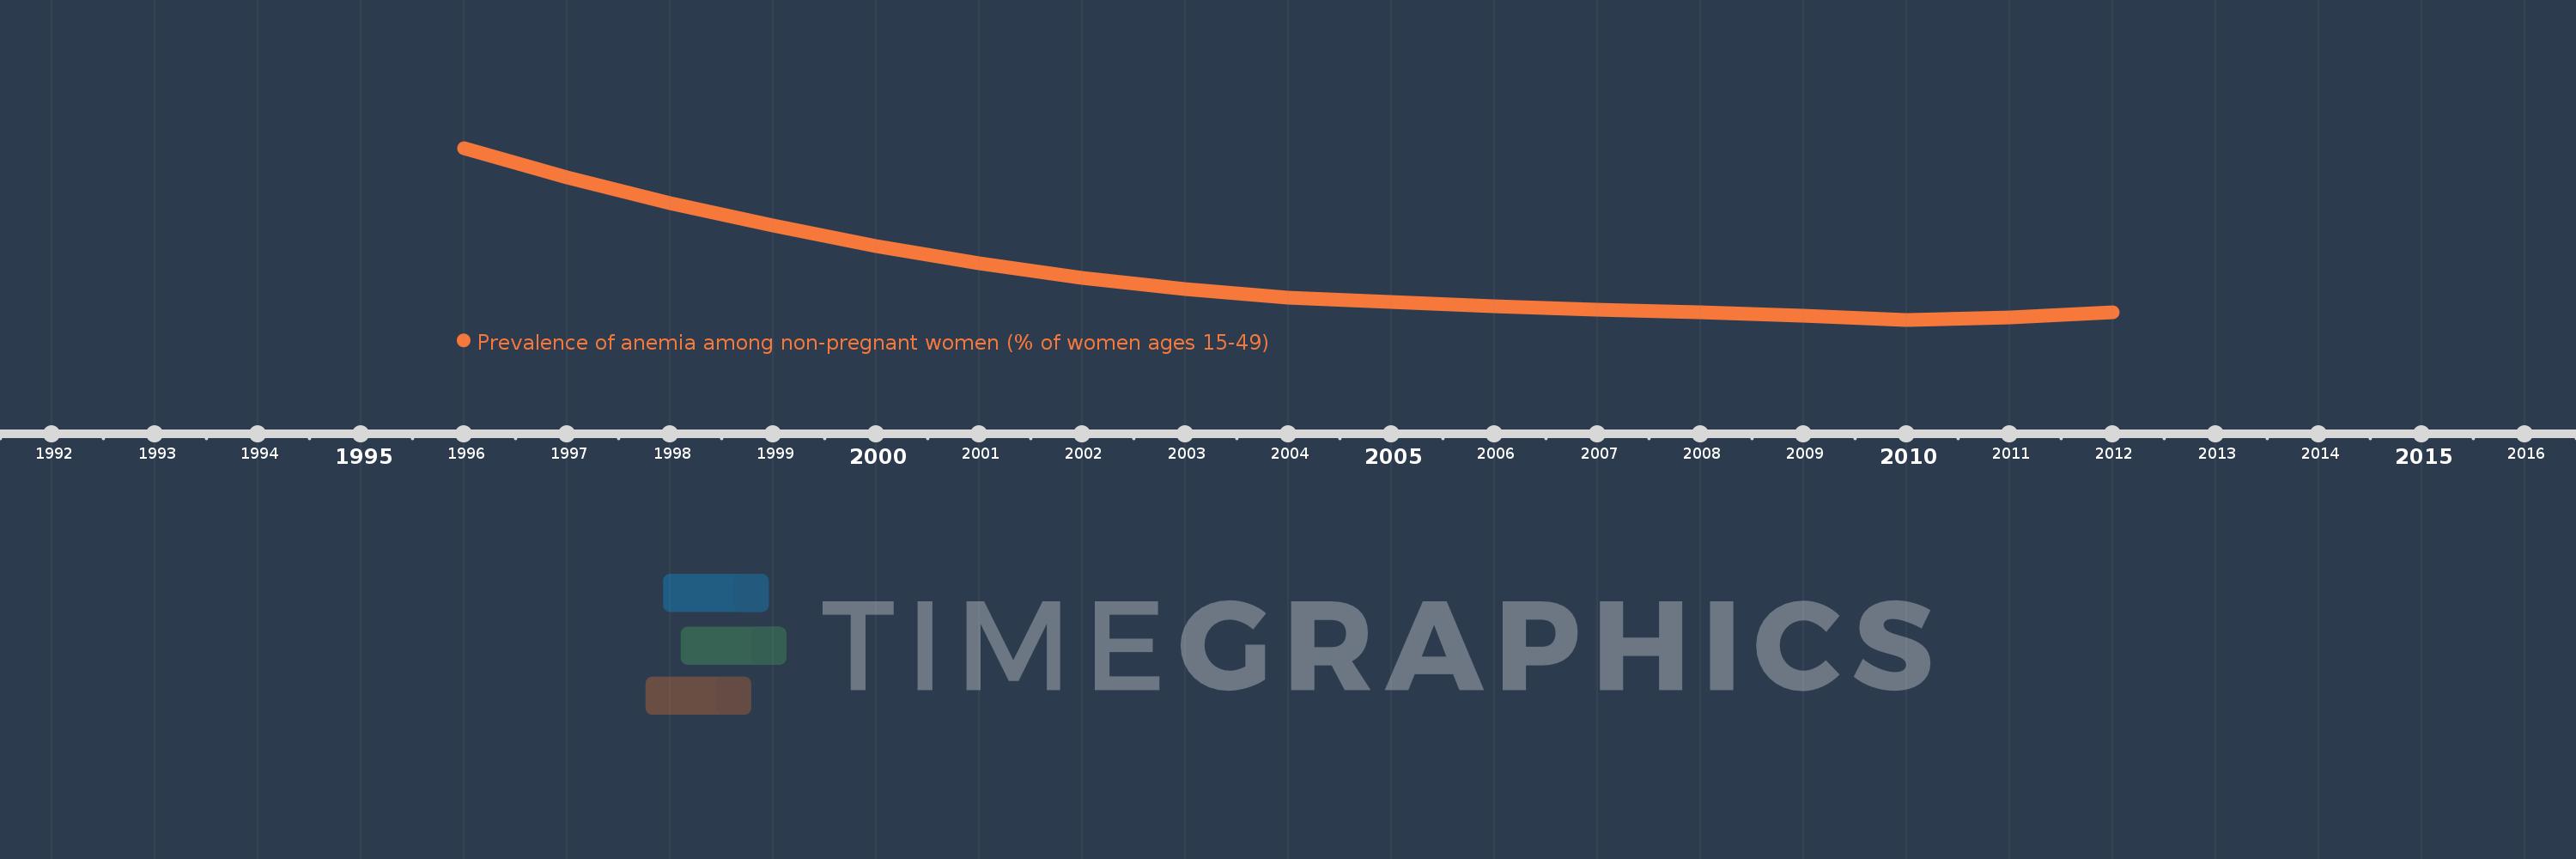
This timeline shows a graph from 1996 to 2012 of Upper middle income. No data until 1995. Number of actual observations by date: 17.
Source name:
World Development Indicators
Source organization:
Stevens GA, Finucane MM, De-Regil LM, et al. Global, regional, and national trends in hemoglobin concentration and prevalence of total and severe anemia in children and pregnant and non-pregnant women for 1995-2011: a systematic analysis of population-representative data. The Lancet Global Health 2013; 1(1): e16-e25.
Categories, topics:
Health
Last updated:
apr 23, 2017
Indicators value changes by year
Meaning:
22.486
Minimum:
20.693
jan 1, 2010
Maximum:
27.148
jan 1, 1996
At the date of observation
Value
Absolute change
Change from the previous value
jan 1, 1996
27.148
+27.148
0.0%
jan 1, 1997
26.037
-1.111
-4.09%
jan 1, 1998
25.064
-0.973
-3.74%
jan 1, 1999
24.222
-0.842
-3.36%
jan 1, 2000
23.456
-0.766
-3.16%
jan 1, 2001
22.812
-0.644
-2.74%
jan 1, 2002
22.273
-0.539
-2.36%
jan 1, 2003
21.845
-0.429
-1.92%
jan 1, 2004
21.527
-0.317
-1.45%
jan 1, 2005
21.358
-0.17
-0.79%
jan 1, 2006
21.192
-0.166
-0.78%
jan 1, 2007
21.06
-0.133
-0.63%
jan 1, 2008
20.978
-0.081
-0.39%
jan 1, 2009
20.84
-0.139
-0.66%
jan 1, 2010
20.693
-0.147
-0.71%
jan 1, 2011
20.774
+0.082
0.4%
jan 1, 2012
20.98
+0.205
0.99%
Ranking of countries by current statistics by years