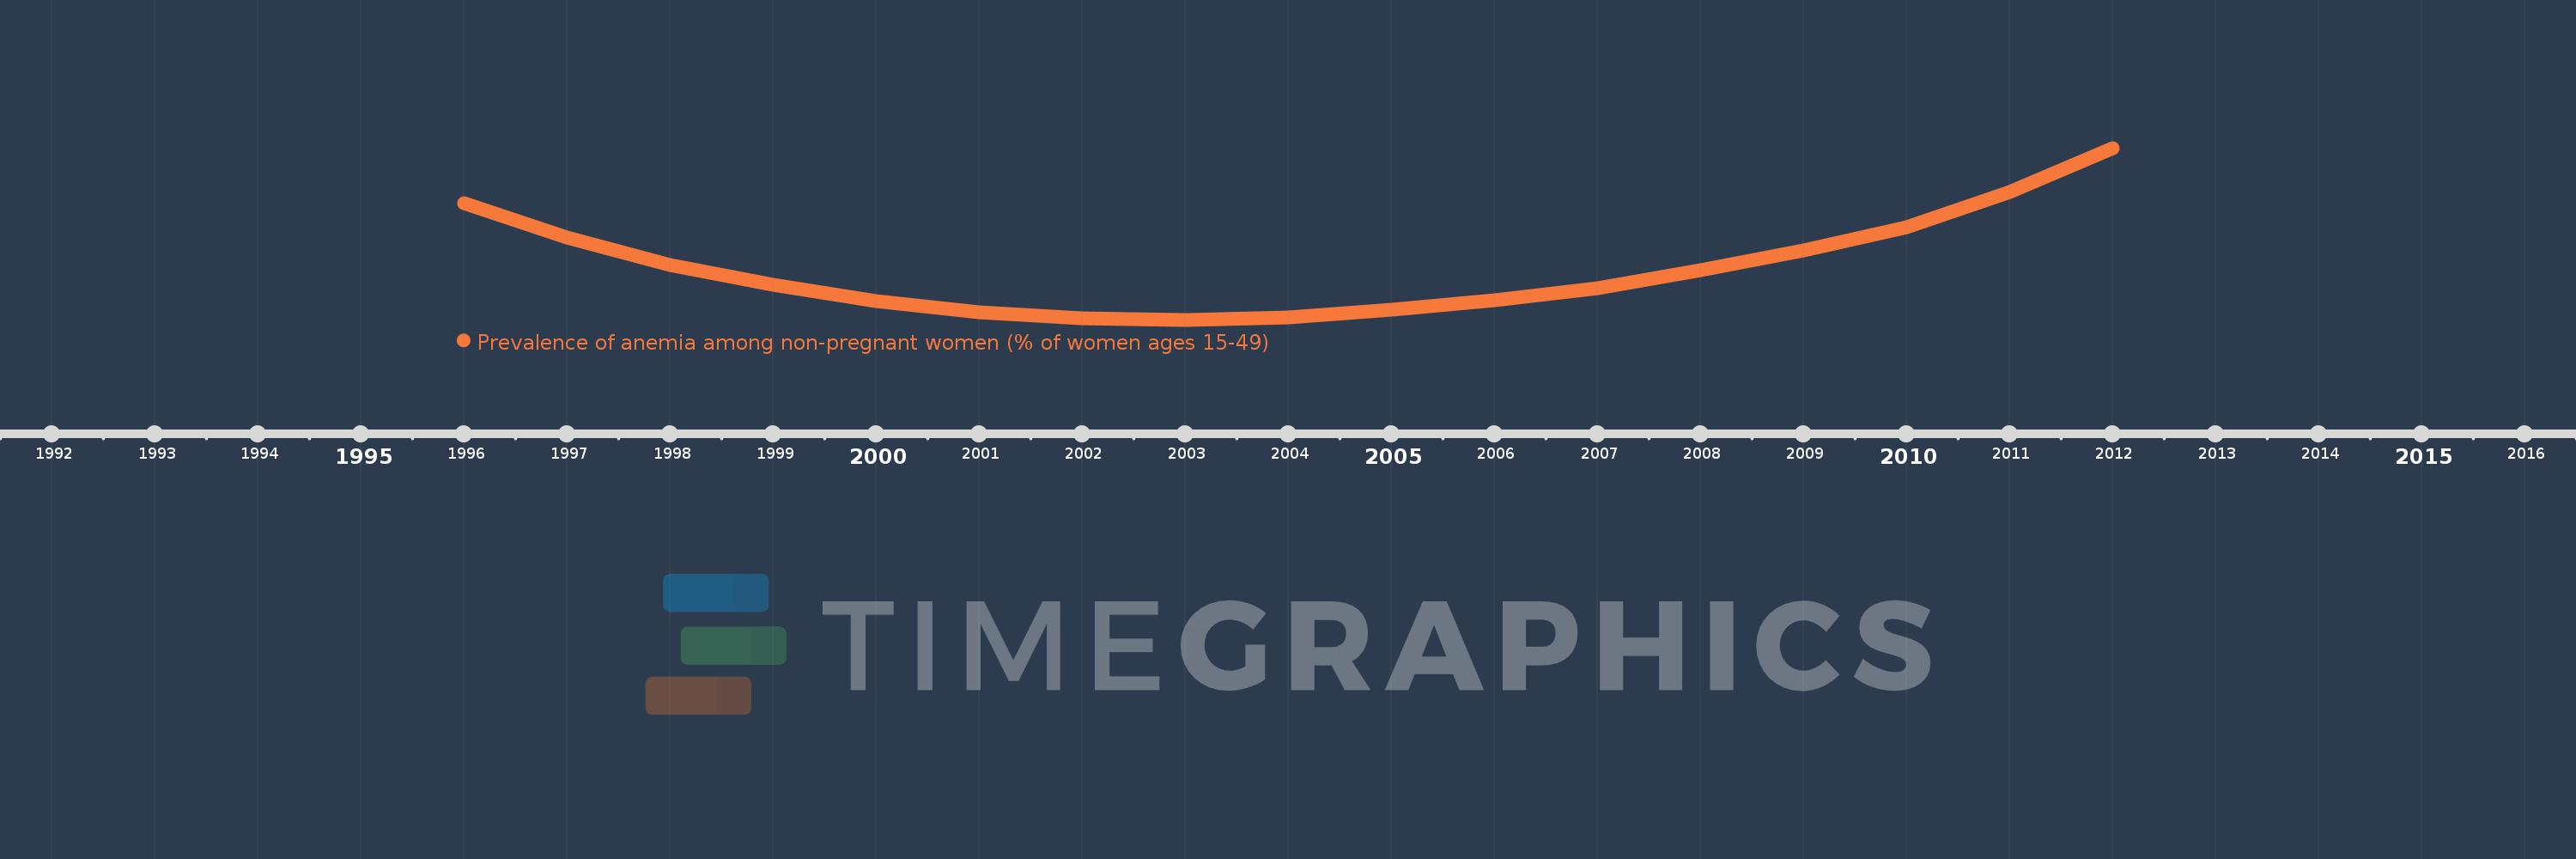
This timeline shows a graph from 1996 to 2012 of Euro area. No data until 1995. Number of actual observations by date: 17.
Source name:
World Development Indicators
Source organization:
Stevens GA, Finucane MM, De-Regil LM, et al. Global, regional, and national trends in hemoglobin concentration and prevalence of total and severe anemia in children and pregnant and non-pregnant women for 1995-2011: a systematic analysis of population-representative data. The Lancet Global Health 2013; 1(1): e16-e25.
Categories, topics:
Health
Last updated:
apr 23, 2017
Indicators value changes by year
Meaning:
16.199
Minimum:
15.141
jan 1, 2003
Maximum:
18.613
jan 1, 2012
At the date of observation
Value
Absolute change
Change from the previous value
jan 1, 1996
17.498
+17.498
0.0%
jan 1, 1997
16.807
-0.691
-3.95%
jan 1, 1998
16.249
-0.558
-3.32%
jan 1, 1999
15.855
-0.394
-2.43%
jan 1, 2000
15.521
-0.334
-2.11%
jan 1, 2001
15.299
-0.222
-1.43%
jan 1, 2002
15.164
-0.135
-0.88%
jan 1, 2003
15.141
-0.022
-0.15%
jan 1, 2004
15.187
+0.046
0.3%
jan 1, 2005
15.337
+0.149
0.98%
jan 1, 2006
15.53
+0.194
1.26%
jan 1, 2007
15.77
+0.239
1.54%
jan 1, 2008
16.137
+0.367
2.33%
jan 1, 2009
16.543
+0.406
2.52%
jan 1, 2010
17.011
+0.468
2.83%
jan 1, 2011
17.722
+0.711
4.18%
jan 1, 2012
18.613
+0.891
5.03%
Ranking of countries by current statistics by years