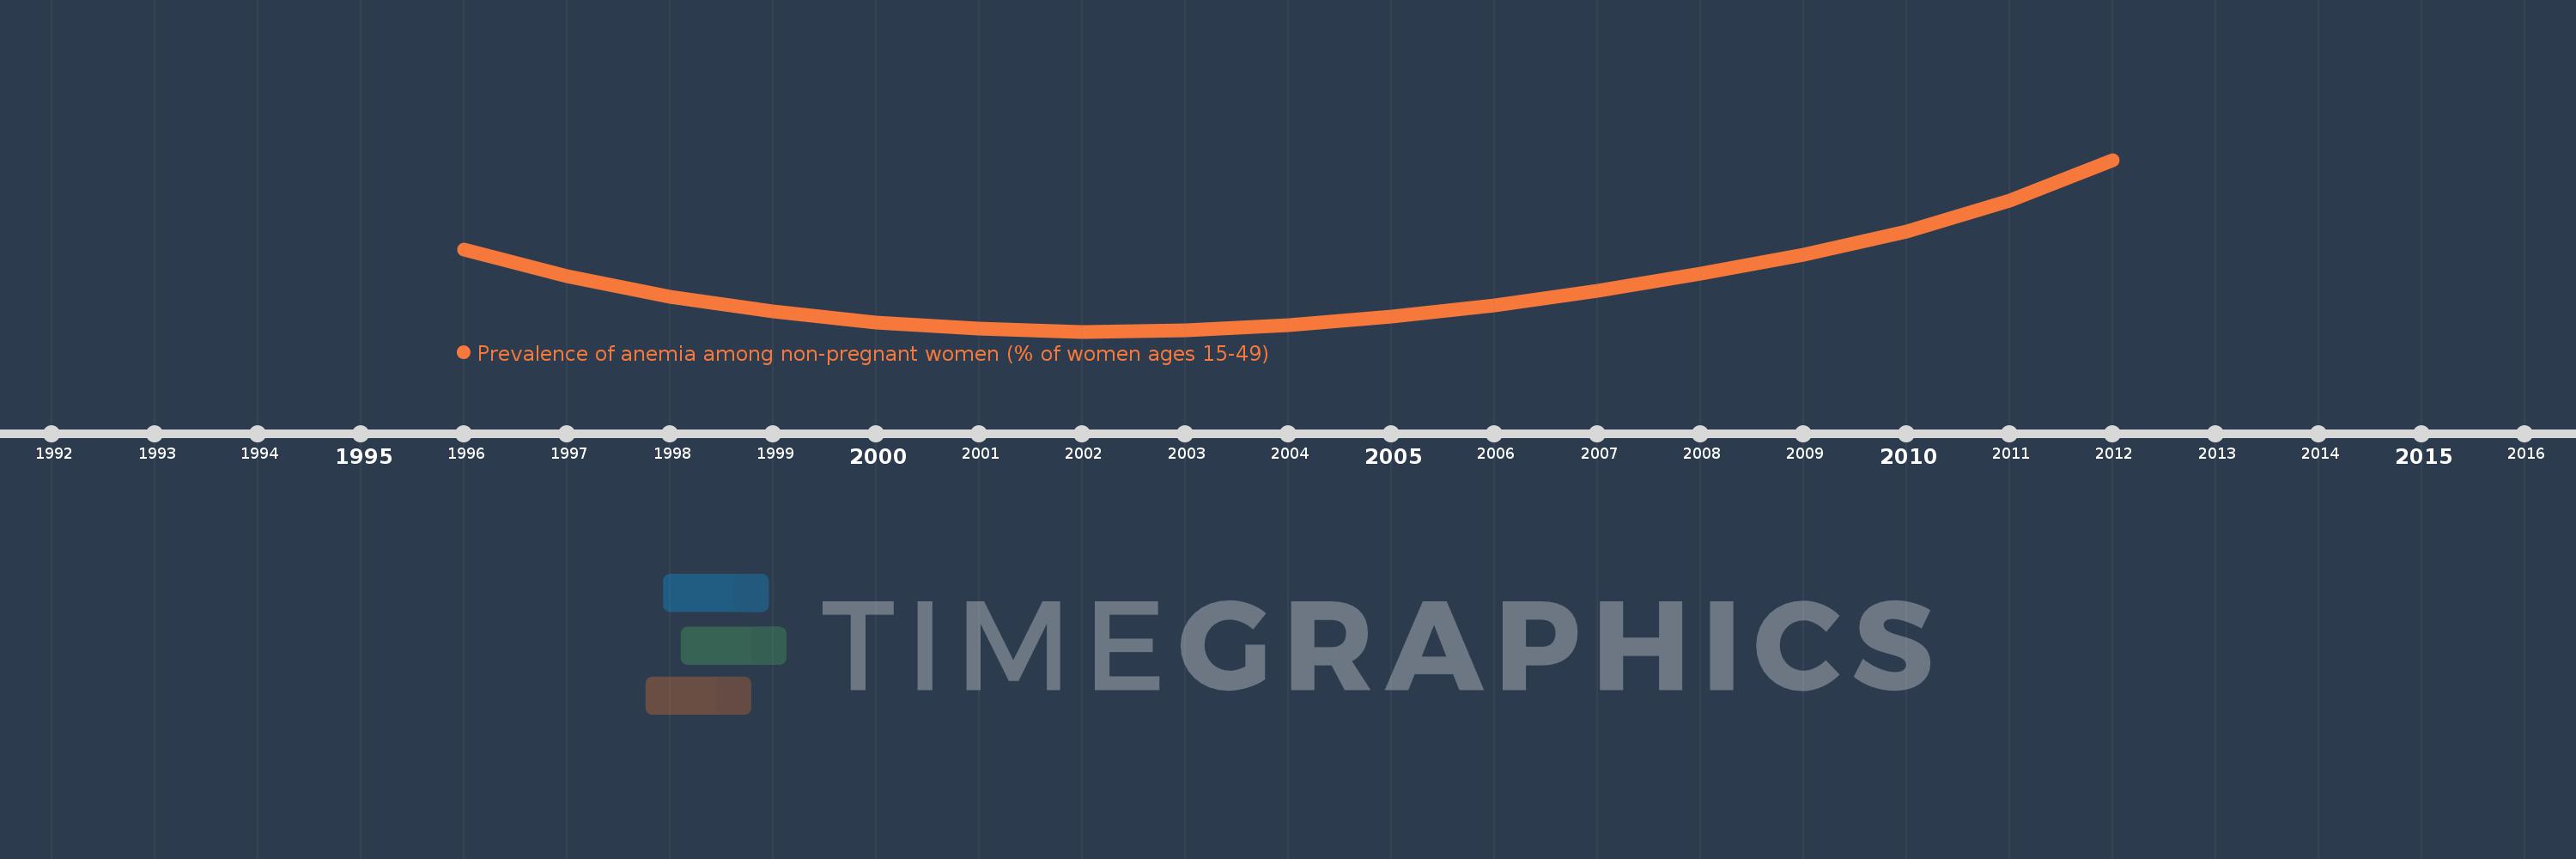
This timeline shows a graph from 1996 to 2012 of High income. No data until 1995. Number of actual observations by date: 17.
Source name:
World Development Indicators
Source organization:
Stevens GA, Finucane MM, De-Regil LM, et al. Global, regional, and national trends in hemoglobin concentration and prevalence of total and severe anemia in children and pregnant and non-pregnant women for 1995-2011: a systematic analysis of population-representative data. The Lancet Global Health 2013; 1(1): e16-e25.
Categories, topics:
Health
Last updated:
apr 23, 2017
Indicators value changes by year
Meaning:
15.142
Minimum:
14.183
jan 1, 2002
Maximum:
17.552
jan 1, 2012
At the date of observation
Value
Absolute change
Change from the previous value
jan 1, 1996
15.786
+15.786
0.0%
jan 1, 1997
15.277
-0.508
-3.22%
jan 1, 1998
14.861
-0.416
-2.73%
jan 1, 1999
14.571
-0.29
-1.95%
jan 1, 2000
14.365
-0.206
-1.41%
jan 1, 2001
14.24
-0.125
-0.87%
jan 1, 2002
14.183
-0.057
-0.4%
jan 1, 2003
14.214
+0.03
0.21%
jan 1, 2004
14.304
+0.09
0.63%
jan 1, 2005
14.474
+0.17
1.19%
jan 1, 2006
14.697
+0.223
1.54%
jan 1, 2007
14.98
+0.283
1.93%
jan 1, 2008
15.324
+0.344
2.3%
jan 1, 2009
15.691
+0.367
2.39%
jan 1, 2010
16.144
+0.453
2.89%
jan 1, 2011
16.746
+0.603
3.73%
jan 1, 2012
17.552
+0.805
4.81%
Ranking of countries by current statistics by years