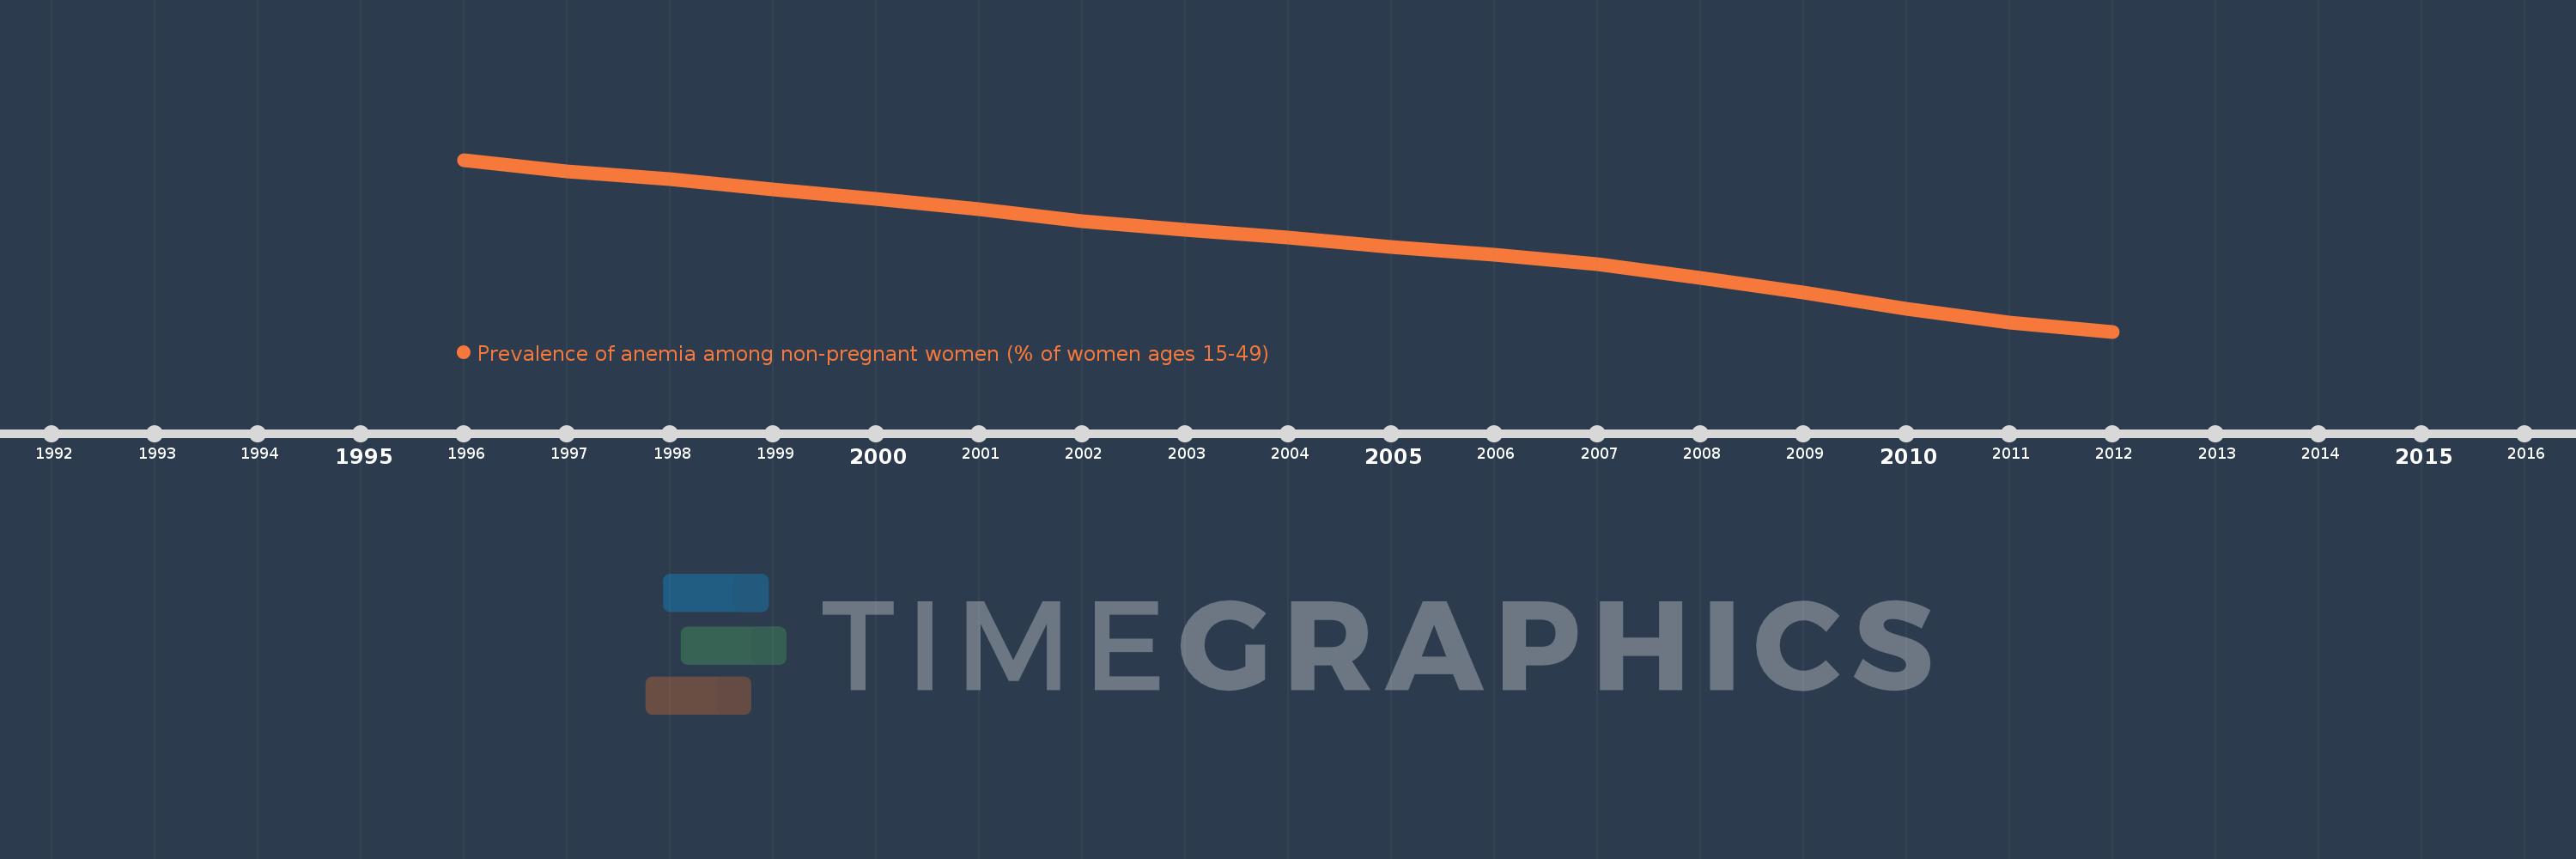
This timeline shows a graph from 1996 to 2012 of IDA blend. No data until 1995. Number of actual observations by date: 17.
Source name:
World Development Indicators
Source organization:
Stevens GA, Finucane MM, De-Regil LM, et al. Global, regional, and national trends in hemoglobin concentration and prevalence of total and severe anemia in children and pregnant and non-pregnant women for 1995-2011: a systematic analysis of population-representative data. The Lancet Global Health 2013; 1(1): e16-e25.
Categories, topics:
Health
Last updated:
apr 23, 2017
Indicators value changes by year
Meaning:
43.046
Minimum:
40.104
jan 1, 2012
Maximum:
45.688
jan 1, 1996
At the date of observation
Value
Absolute change
Change from the previous value
jan 1, 1996
45.688
+45.688
0.0%
jan 1, 1997
45.308
-0.38
-0.83%
jan 1, 1998
45.053
-0.255
-0.56%
jan 1, 1999
44.722
-0.332
-0.74%
jan 1, 2000
44.418
-0.304
-0.68%
jan 1, 2001
44.073
-0.345
-0.78%
jan 1, 2002
43.681
-0.392
-0.89%
jan 1, 2003
43.406
-0.275
-0.63%
jan 1, 2004
43.157
-0.249
-0.57%
jan 1, 2005
42.863
-0.293
-0.68%
jan 1, 2006
42.594
-0.27
-0.63%
jan 1, 2007
42.294
-0.299
-0.7%
jan 1, 2008
41.841
-0.453
-1.07%
jan 1, 2009
41.366
-0.475
-1.14%
jan 1, 2010
40.83
-0.536
-1.29%
jan 1, 2011
40.387
-0.444
-1.09%
jan 1, 2012
40.104
-0.282
-0.7%
Ranking of countries by current statistics by years