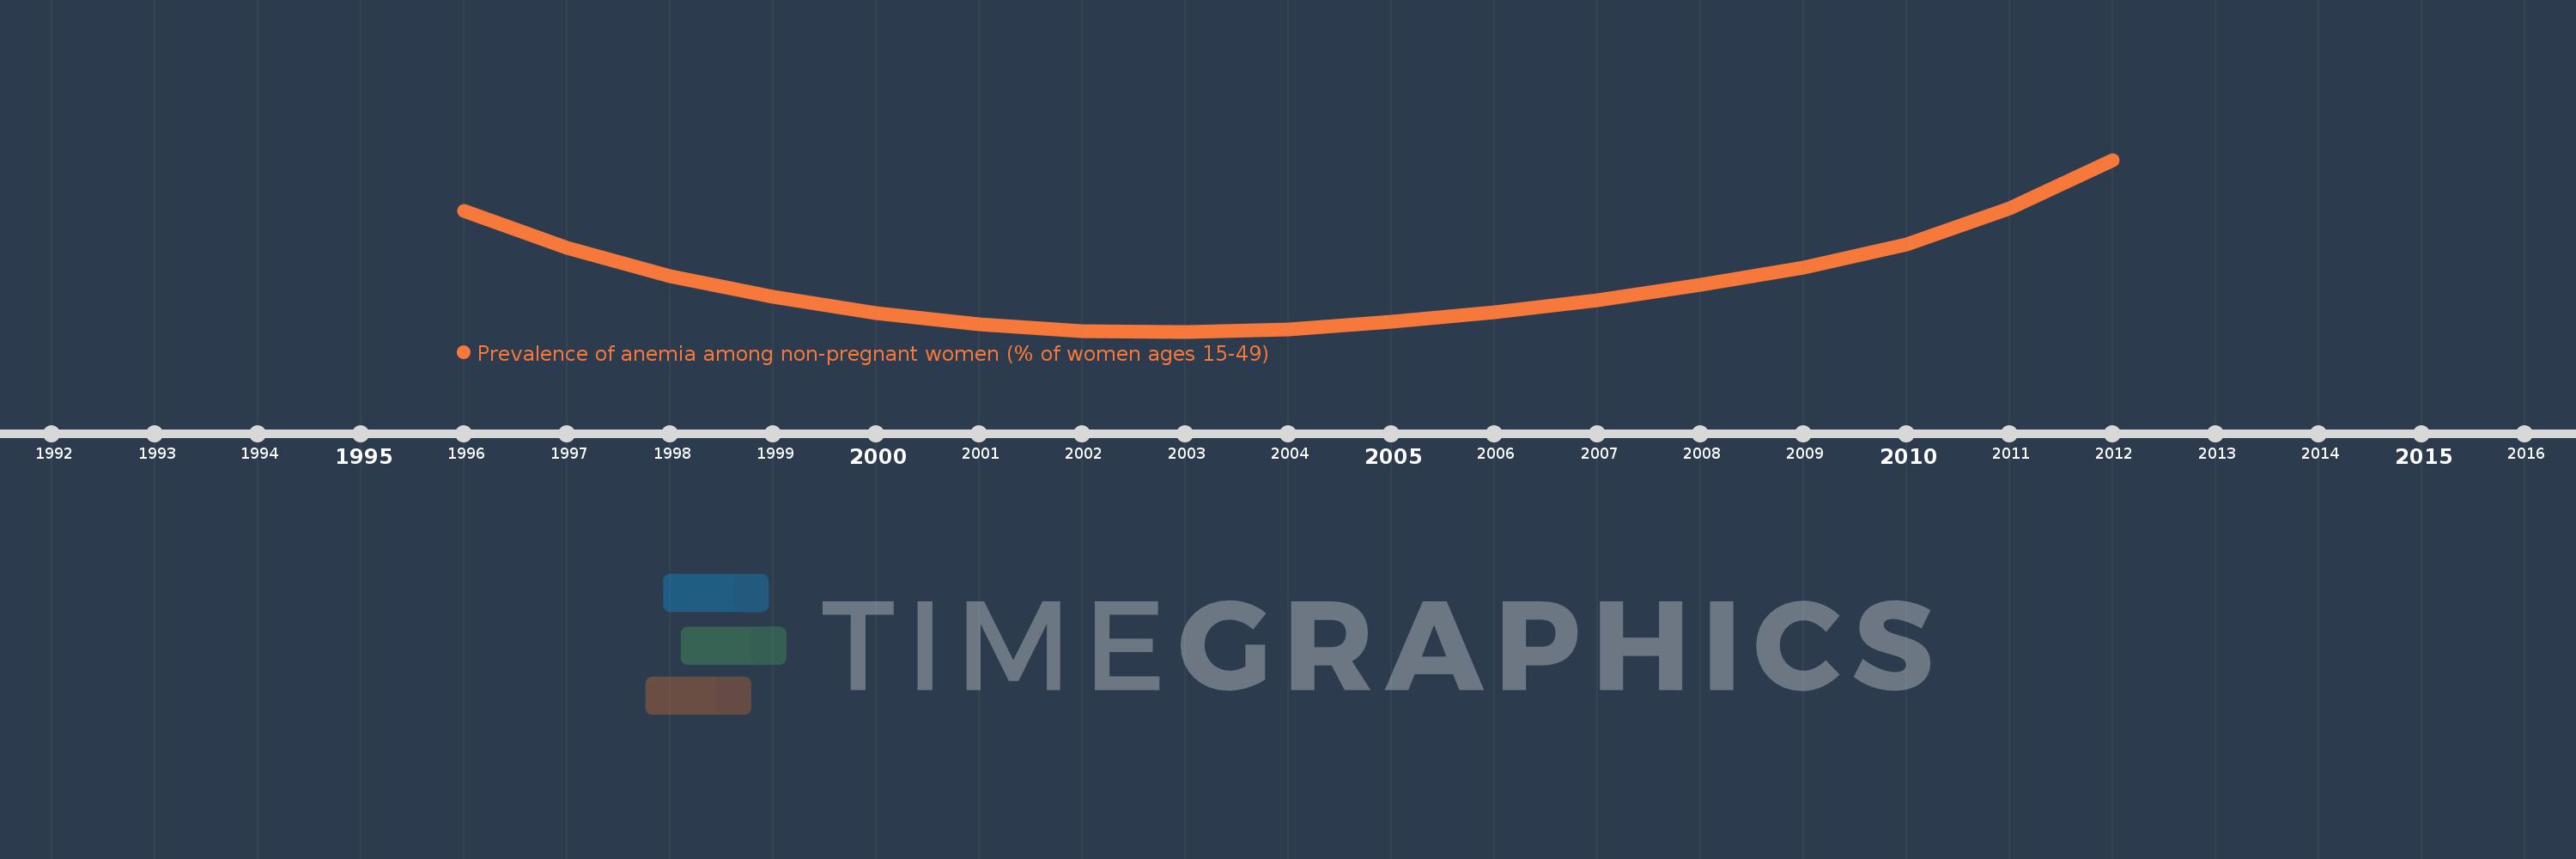
This timeline shows a graph from 1996 to 2012 of European Union. No data until 1995. Number of actual observations by date: 17.
Source name:
World Development Indicators
Source organization:
Stevens GA, Finucane MM, De-Regil LM, et al. Global, regional, and national trends in hemoglobin concentration and prevalence of total and severe anemia in children and pregnant and non-pregnant women for 1995-2011: a systematic analysis of population-representative data. The Lancet Global Health 2013; 1(1): e16-e25.
Categories, topics:
Health
Last updated:
apr 23, 2017
Indicators value changes by year
Meaning:
16.902
Minimum:
16.023
jan 1, 2003
Maximum:
18.952
jan 1, 2012
At the date of observation
Value
Absolute change
Change from the previous value
jan 1, 1996
18.082
+18.082
0.0%
jan 1, 1997
17.448
-0.634
-3.5%
jan 1, 1998
16.966
-0.482
-2.76%
jan 1, 1999
16.618
-0.348
-2.05%
jan 1, 2000
16.336
-0.282
-1.7%
jan 1, 2001
16.149
-0.187
-1.15%
jan 1, 2002
16.028
-0.12
-0.75%
jan 1, 2003
16.023
-0.005
-0.03%
jan 1, 2004
16.065
+0.042
0.26%
jan 1, 2005
16.196
+0.131
0.82%
jan 1, 2006
16.352
+0.156
0.96%
jan 1, 2007
16.553
+0.201
1.23%
jan 1, 2008
16.816
+0.263
1.59%
jan 1, 2009
17.121
+0.305
1.81%
jan 1, 2010
17.508
+0.387
2.26%
jan 1, 2011
18.123
+0.615
3.51%
jan 1, 2012
18.952
+0.829
4.58%
Ranking of countries by current statistics by years