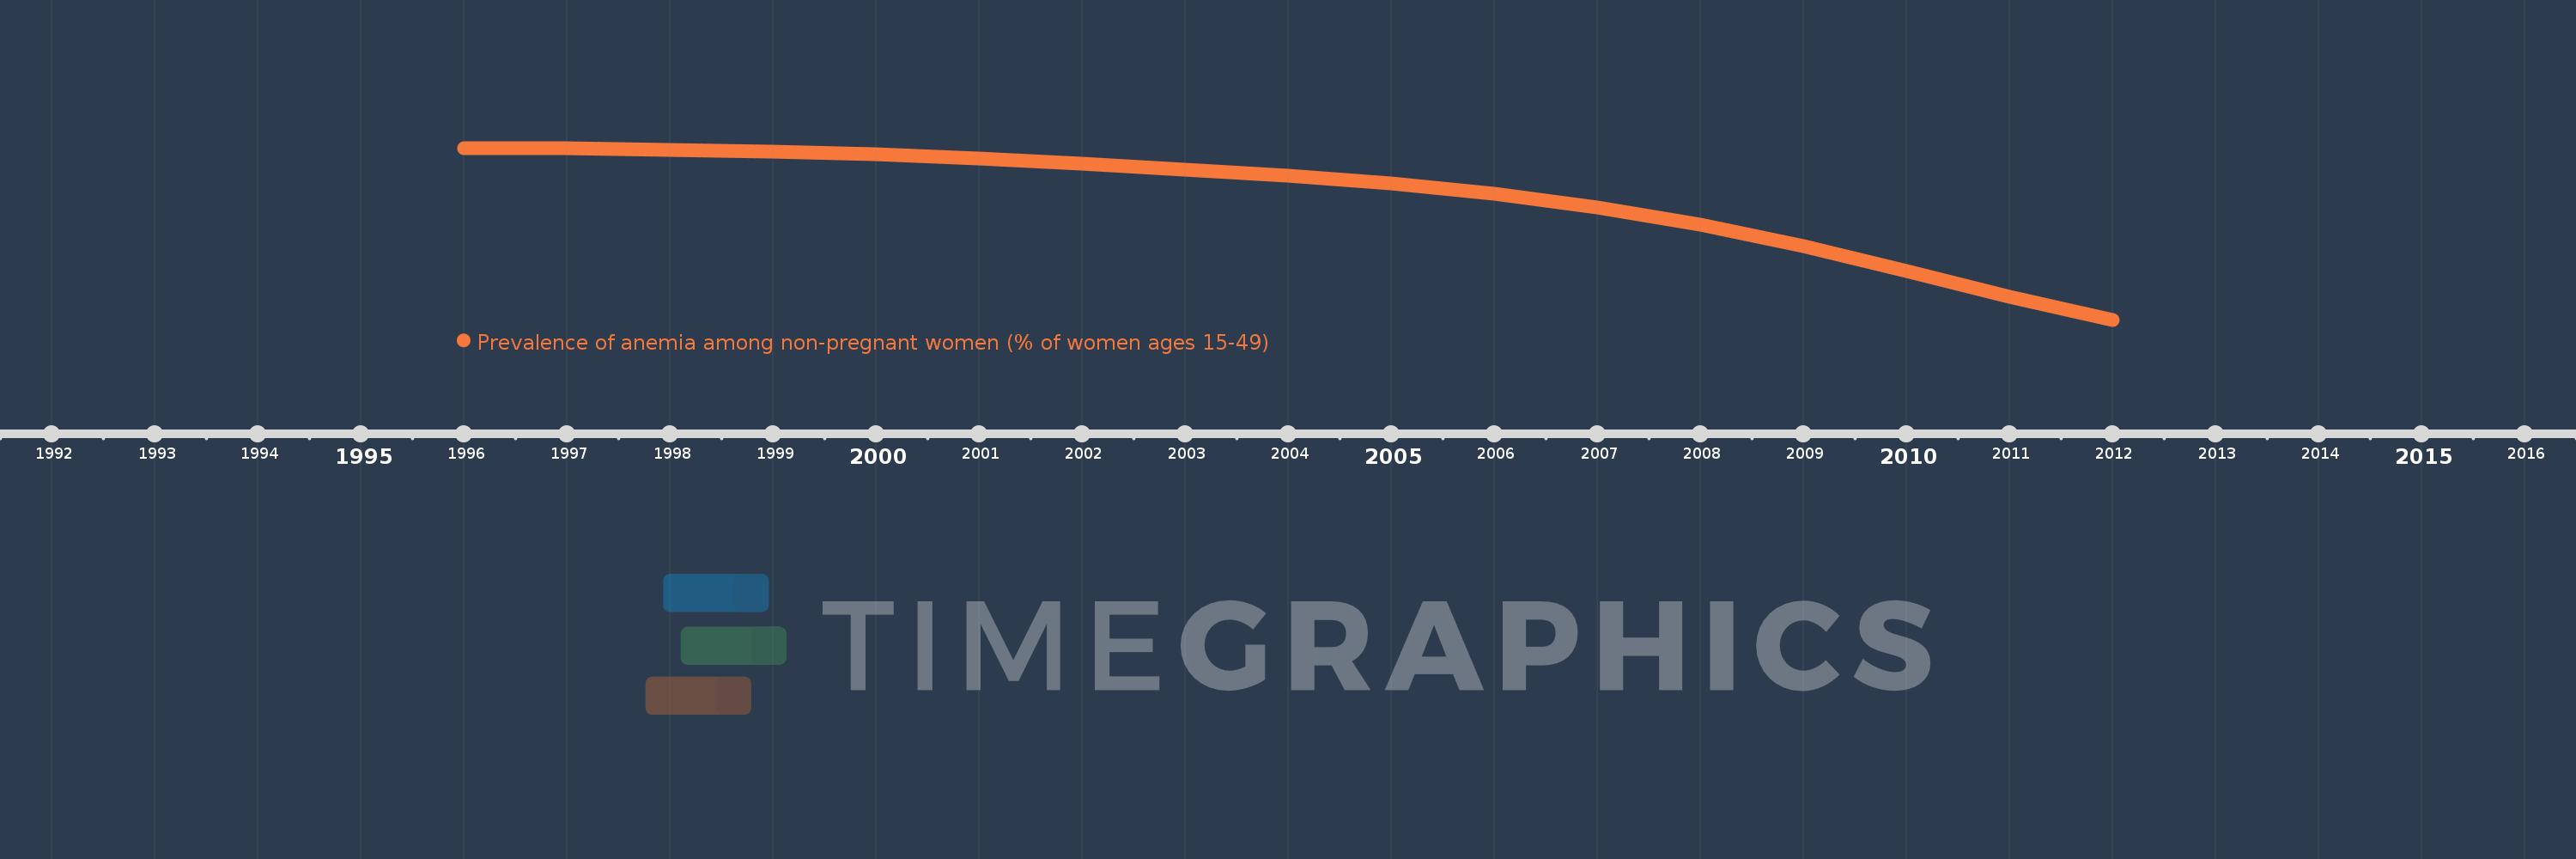
This timeline shows a graph from 1996 to 2012 of Low income. No data until 1995. Number of actual observations by date: 17.
Source name:
World Development Indicators
Source organization:
Stevens GA, Finucane MM, De-Regil LM, et al. Global, regional, and national trends in hemoglobin concentration and prevalence of total and severe anemia in children and pregnant and non-pregnant women for 1995-2011: a systematic analysis of population-representative data. The Lancet Global Health 2013; 1(1): e16-e25.
Categories, topics:
Health
Last updated:
apr 23, 2017
Indicators value changes by year
Meaning:
41.851
Minimum:
35.468
jan 1, 2012
Maximum:
44.462
jan 1, 1996
At the date of observation
Value
Absolute change
Change from the previous value
jan 1, 1996
44.462
+44.462
0.0%
jan 1, 1997
44.442
-0.02
-0.05%
jan 1, 1998
44.377
-0.064
-0.14%
jan 1, 1999
44.277
-0.1
-0.23%
jan 1, 2000
44.117
-0.16
-0.36%
jan 1, 2001
43.908
-0.209
-0.47%
jan 1, 2002
43.631
-0.277
-0.63%
jan 1, 2003
43.327
-0.304
-0.7%
jan 1, 2004
43.009
-0.318
-0.73%
jan 1, 2005
42.594
-0.415
-0.97%
jan 1, 2006
42.045
-0.549
-1.29%
jan 1, 2007
41.351
-0.694
-1.65%
jan 1, 2008
40.457
-0.894
-2.16%
jan 1, 2009
39.333
-1.124
-2.78%
jan 1, 2010
38.019
-1.314
-3.34%
jan 1, 2011
36.647
-1.372
-3.61%
jan 1, 2012
35.468
-1.179
-3.22%
Ranking of countries by current statistics by years