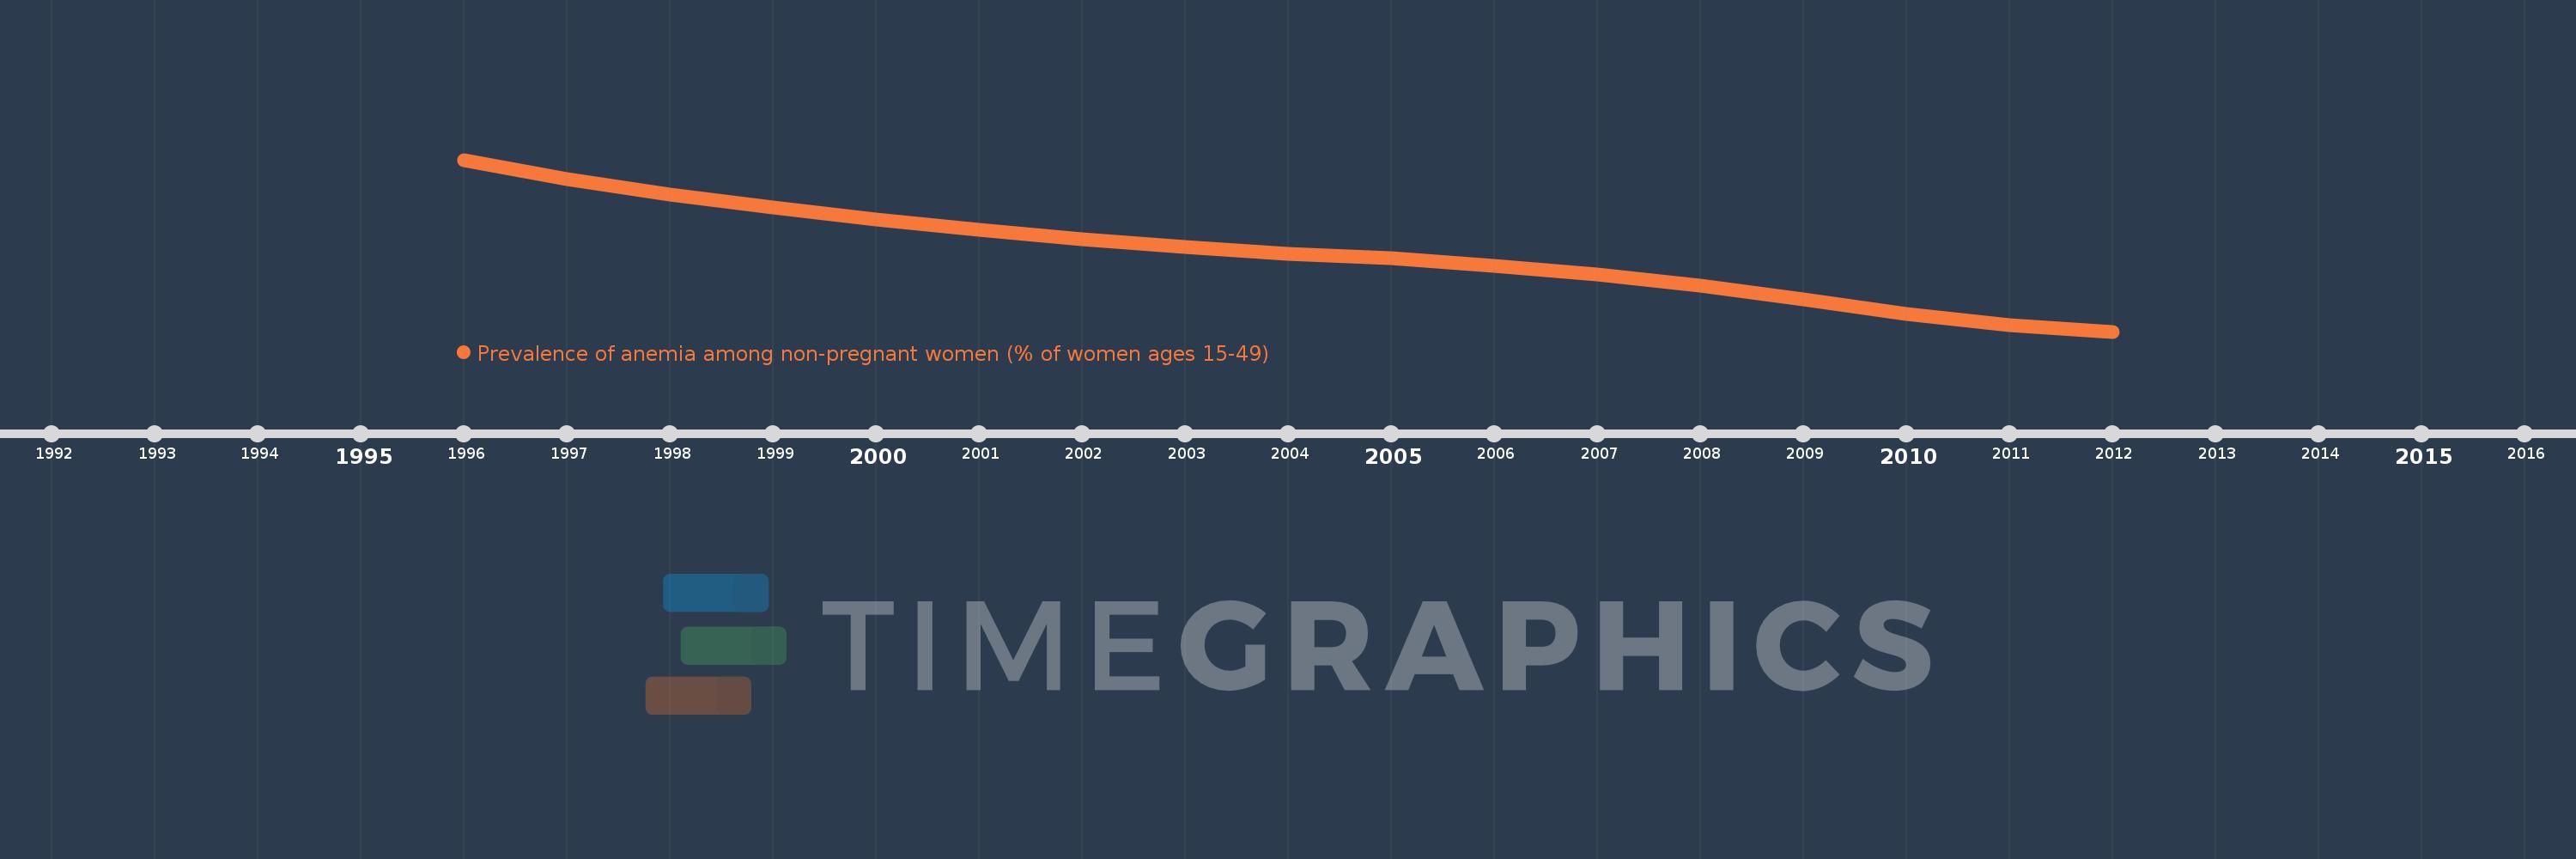
This timeline shows a graph from 1996 to 2012 of Middle income. No data until 1995. Number of actual observations by date: 17.
Source name:
World Development Indicators
Source organization:
Stevens GA, Finucane MM, De-Regil LM, et al. Global, regional, and national trends in hemoglobin concentration and prevalence of total and severe anemia in children and pregnant and non-pregnant women for 1995-2011: a systematic analysis of population-representative data. The Lancet Global Health 2013; 1(1): e16-e25.
Categories, topics:
Health
Last updated:
apr 23, 2017
Indicators value changes by year
Meaning:
33.396
Minimum:
30.705
jan 1, 2012
Maximum:
36.52
jan 1, 1996
At the date of observation
Value
Absolute change
Change from the previous value
jan 1, 1996
36.52
+36.52
0.0%
jan 1, 1997
35.871
-0.65
-1.78%
jan 1, 1998
35.351
-0.52
-1.45%
jan 1, 1999
34.905
-0.446
-1.26%
jan 1, 2000
34.49
-0.415
-1.19%
jan 1, 2001
34.151
-0.34
-0.99%
jan 1, 2002
33.837
-0.314
-0.92%
jan 1, 2003
33.567
-0.27
-0.8%
jan 1, 2004
33.35
-0.216
-0.64%
jan 1, 2005
33.179
-0.171
-0.51%
jan 1, 2006
32.932
-0.247
-0.74%
jan 1, 2007
32.632
-0.3
-0.91%
jan 1, 2008
32.26
-0.372
-1.14%
jan 1, 2009
31.79
-0.47
-1.46%
jan 1, 2010
31.287
-0.504
-1.58%
jan 1, 2011
30.91
-0.377
-1.2%
jan 1, 2012
30.705
-0.205
-0.66%
Ranking of countries by current statistics by years