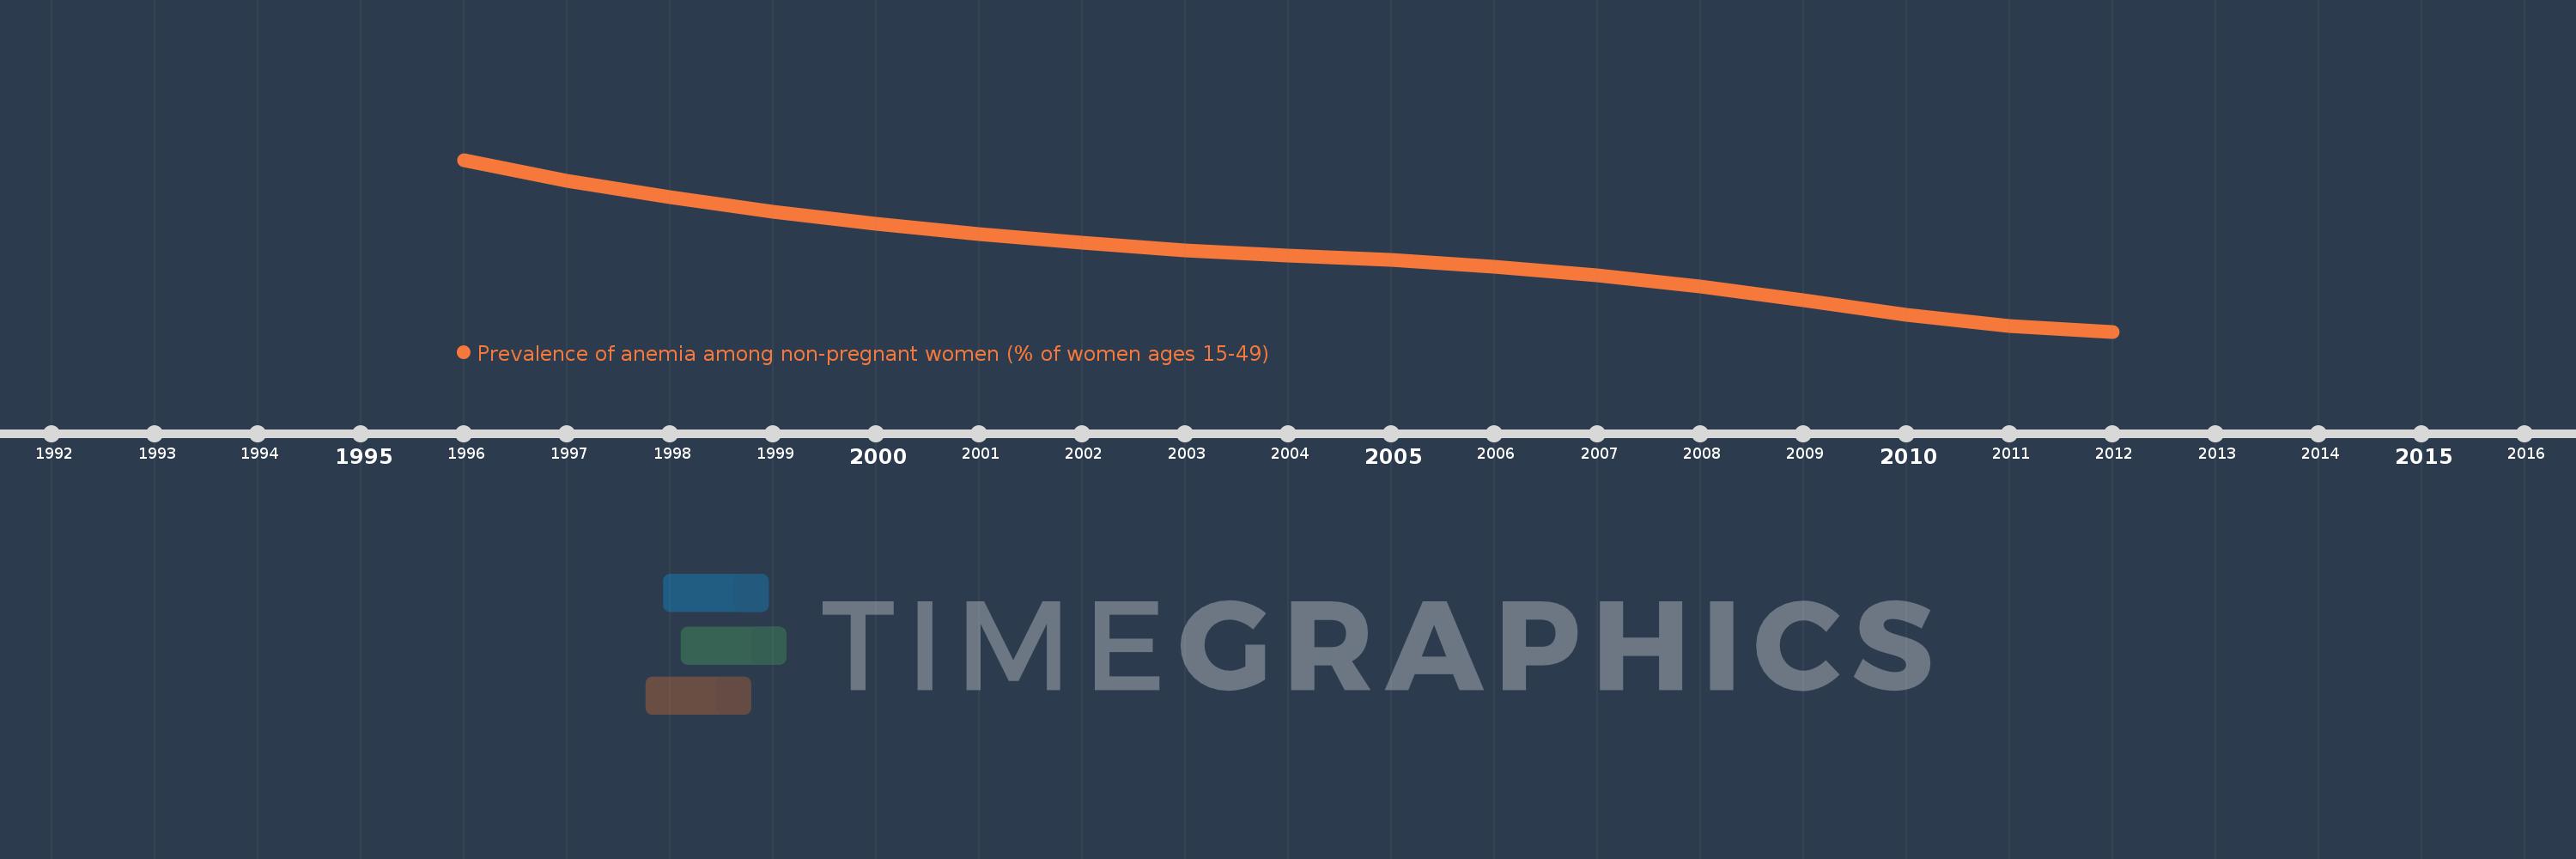
This timeline shows a graph from 1996 to 2012 of IBRD only. No data until 1995. Number of actual observations by date: 17.
Source name:
World Development Indicators
Source organization:
Stevens GA, Finucane MM, De-Regil LM, et al. Global, regional, and national trends in hemoglobin concentration and prevalence of total and severe anemia in children and pregnant and non-pregnant women for 1995-2011: a systematic analysis of population-representative data. The Lancet Global Health 2013; 1(1): e16-e25.
Categories, topics:
Health
Last updated:
apr 23, 2017
Indicators value changes by year
Meaning:
31.414
Minimum:
28.843
jan 1, 2012
Maximum:
34.533
jan 1, 1996
At the date of observation
Value
Absolute change
Change from the previous value
jan 1, 1996
34.533
+34.533
0.0%
jan 1, 1997
33.842
-0.691
-2.0%
jan 1, 1998
33.285
-0.557
-1.65%
jan 1, 1999
32.824
-0.461
-1.38%
jan 1, 2000
32.402
-0.422
-1.29%
jan 1, 2001
32.079
-0.323
-1.0%
jan 1, 2002
31.789
-0.29
-0.9%
jan 1, 2003
31.542
-0.247
-0.78%
jan 1, 2004
31.347
-0.194
-0.62%
jan 1, 2005
31.21
-0.137
-0.44%
jan 1, 2006
30.98
-0.23
-0.74%
jan 1, 2007
30.697
-0.283
-0.91%
jan 1, 2008
30.347
-0.35
-1.14%
jan 1, 2009
29.888
-0.459
-1.51%
jan 1, 2010
29.394
-0.494
-1.65%
jan 1, 2011
29.035
-0.358
-1.22%
jan 1, 2012
28.843
-0.192
-0.66%
Ranking of countries by current statistics by years