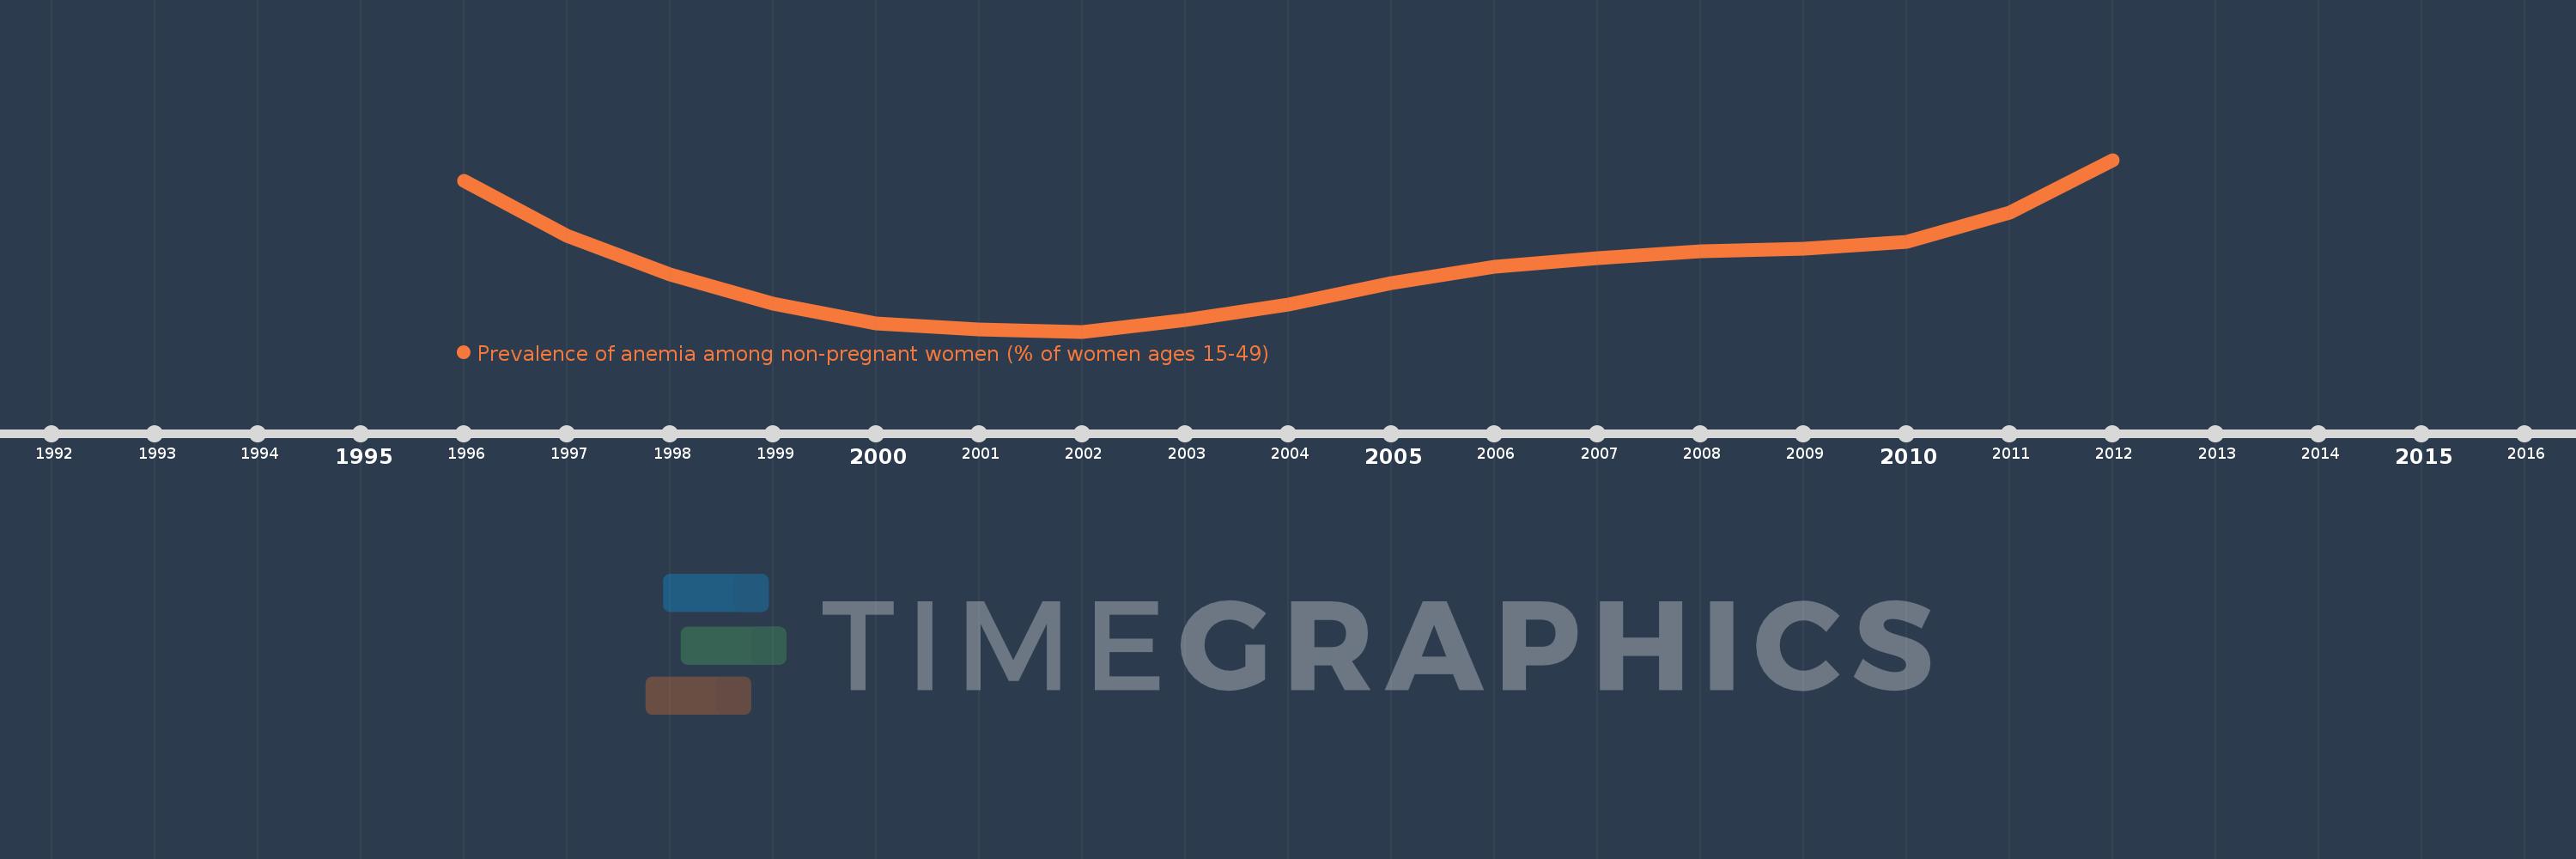
This timeline shows a graph from 1996 to 2012 of Europe & Central Asia. No data until 1995. Number of actual observations by date: 17.
Source name:
World Development Indicators
Source organization:
Stevens GA, Finucane MM, De-Regil LM, et al. Global, regional, and national trends in hemoglobin concentration and prevalence of total and severe anemia in children and pregnant and non-pregnant women for 1995-2011: a systematic analysis of population-representative data. The Lancet Global Health 2013; 1(1): e16-e25.
Categories, topics:
Health
Last updated:
apr 23, 2017
Indicators value changes by year
Meaning:
21.71
Minimum:
21.17
jan 1, 2002
Maximum:
22.59
jan 1, 2012
At the date of observation
Value
Absolute change
Change from the previous value
jan 1, 1996
22.415
+22.415
0.0%
jan 1, 1997
21.963
-0.452
-2.02%
jan 1, 1998
21.64
-0.323
-1.47%
jan 1, 1999
21.402
-0.238
-1.1%
jan 1, 2000
21.238
-0.164
-0.77%
jan 1, 2001
21.188
-0.05
-0.24%
jan 1, 2002
21.17
-0.017
-0.08%
jan 1, 2003
21.267
+0.096
0.45%
jan 1, 2004
21.397
+0.131
0.62%
jan 1, 2005
21.568
+0.171
0.8%
jan 1, 2006
21.704
+0.135
0.63%
jan 1, 2007
21.774
+0.07
0.32%
jan 1, 2008
21.836
+0.062
0.28%
jan 1, 2009
21.852
+0.016
0.07%
jan 1, 2010
21.909
+0.057
0.26%
jan 1, 2011
22.151
+0.242
1.11%
jan 1, 2012
22.59
+0.439
1.98%
Ranking of countries by current statistics by years