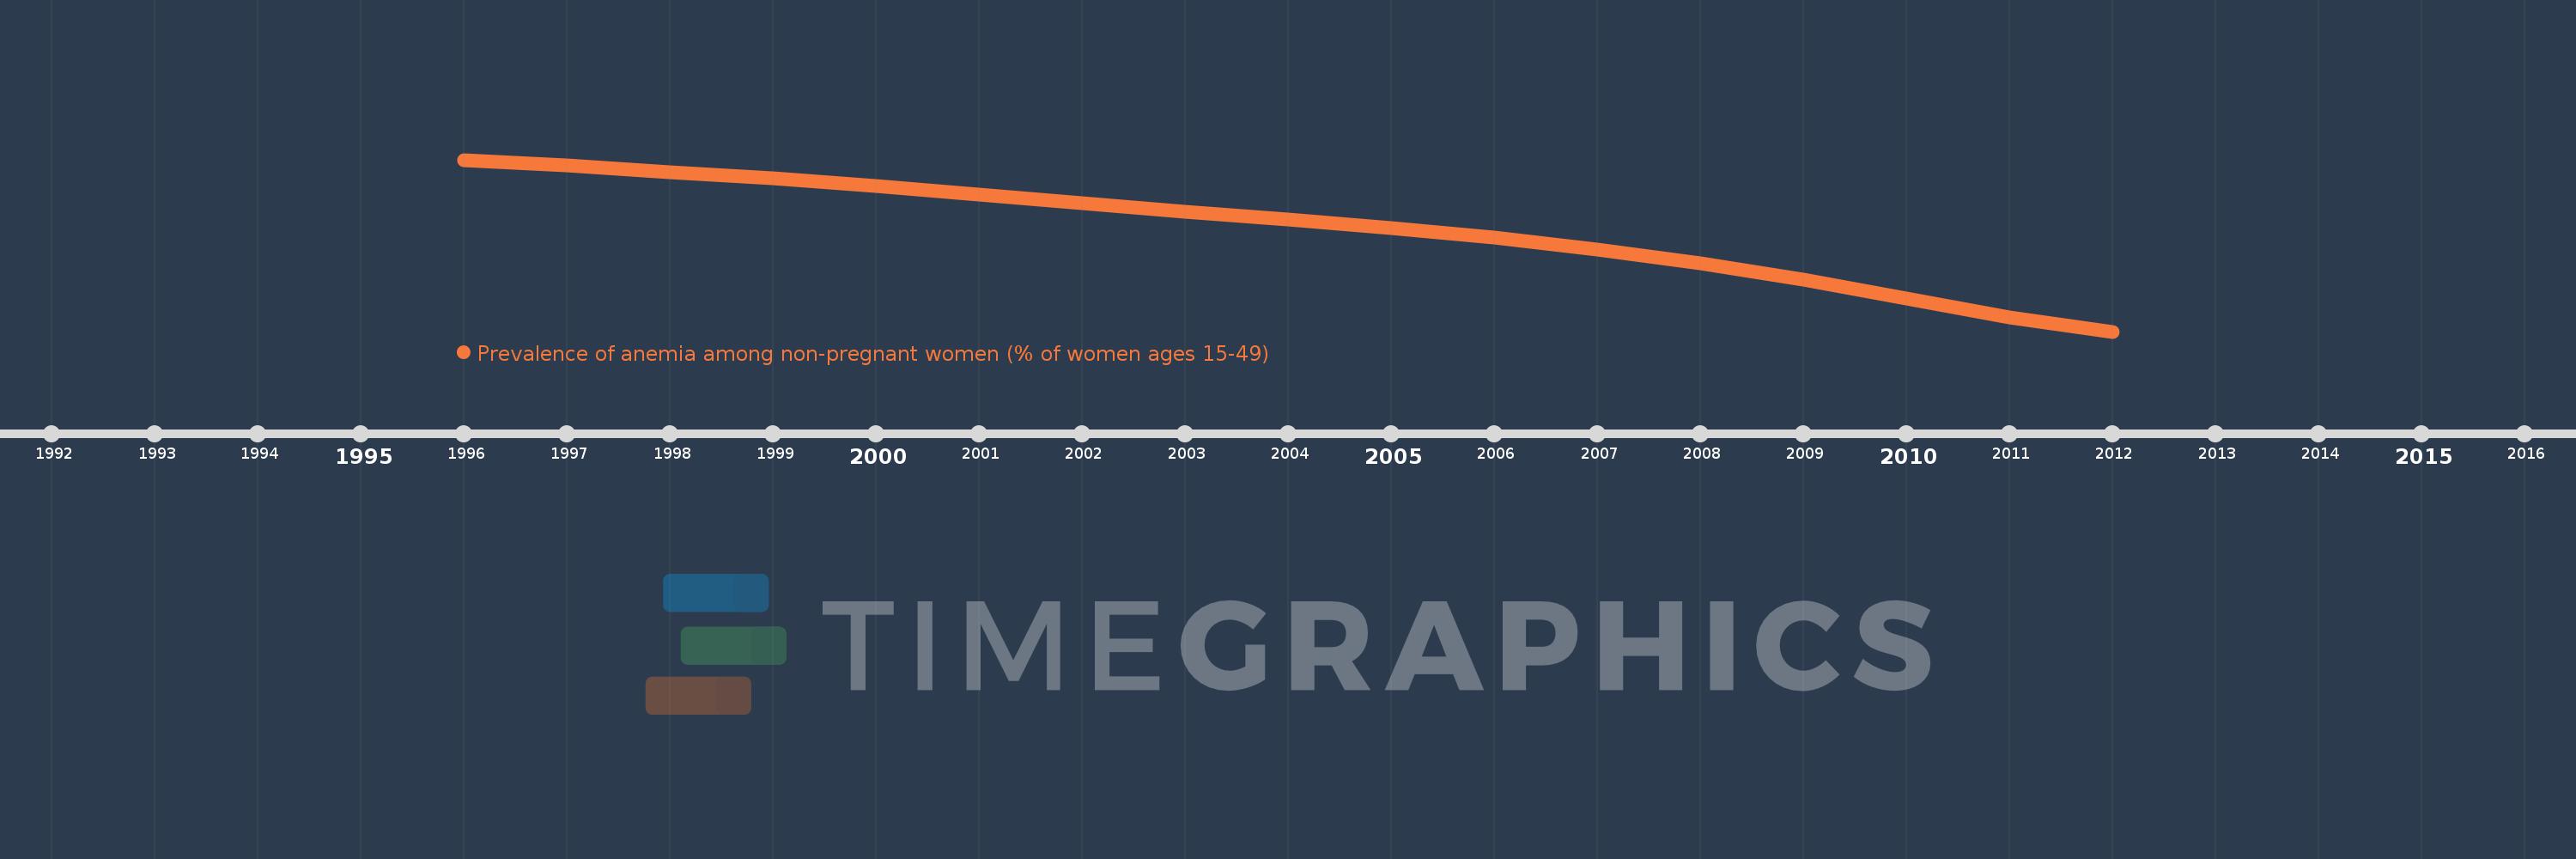
This timeline shows a graph from 1996 to 2012 of IDA only. No data until 1995. Number of actual observations by date: 17.
Source name:
World Development Indicators
Source organization:
Stevens GA, Finucane MM, De-Regil LM, et al. Global, regional, and national trends in hemoglobin concentration and prevalence of total and severe anemia in children and pregnant and non-pregnant women for 1995-2011: a systematic analysis of population-representative data. The Lancet Global Health 2013; 1(1): e16-e25.
Categories, topics:
Health
Last updated:
apr 23, 2017
Indicators value changes by year
Meaning:
42.266
Minimum:
36.603
jan 1, 2012
Maximum:
46.092
jan 1, 1996
At the date of observation
Value
Absolute change
Change from the previous value
jan 1, 1996
46.092
+46.092
0.0%
jan 1, 1997
45.763
-0.328
-0.71%
jan 1, 1998
45.423
-0.34
-0.74%
jan 1, 1999
45.059
-0.364
-0.8%
jan 1, 2000
44.644
-0.415
-0.92%
jan 1, 2001
44.185
-0.459
-1.03%
jan 1, 2002
43.716
-0.469
-1.06%
jan 1, 2003
43.243
-0.473
-1.08%
jan 1, 2004
42.81
-0.433
-1.0%
jan 1, 2005
42.335
-0.475
-1.11%
jan 1, 2006
41.799
-0.536
-1.26%
jan 1, 2007
41.154
-0.645
-1.54%
jan 1, 2008
40.38
-0.774
-1.88%
jan 1, 2009
39.46
-0.92
-2.28%
jan 1, 2010
38.44
-1.019
-2.58%
jan 1, 2011
37.408
-1.033
-2.69%
jan 1, 2012
36.603
-0.805
-2.15%
Ranking of countries by current statistics by years