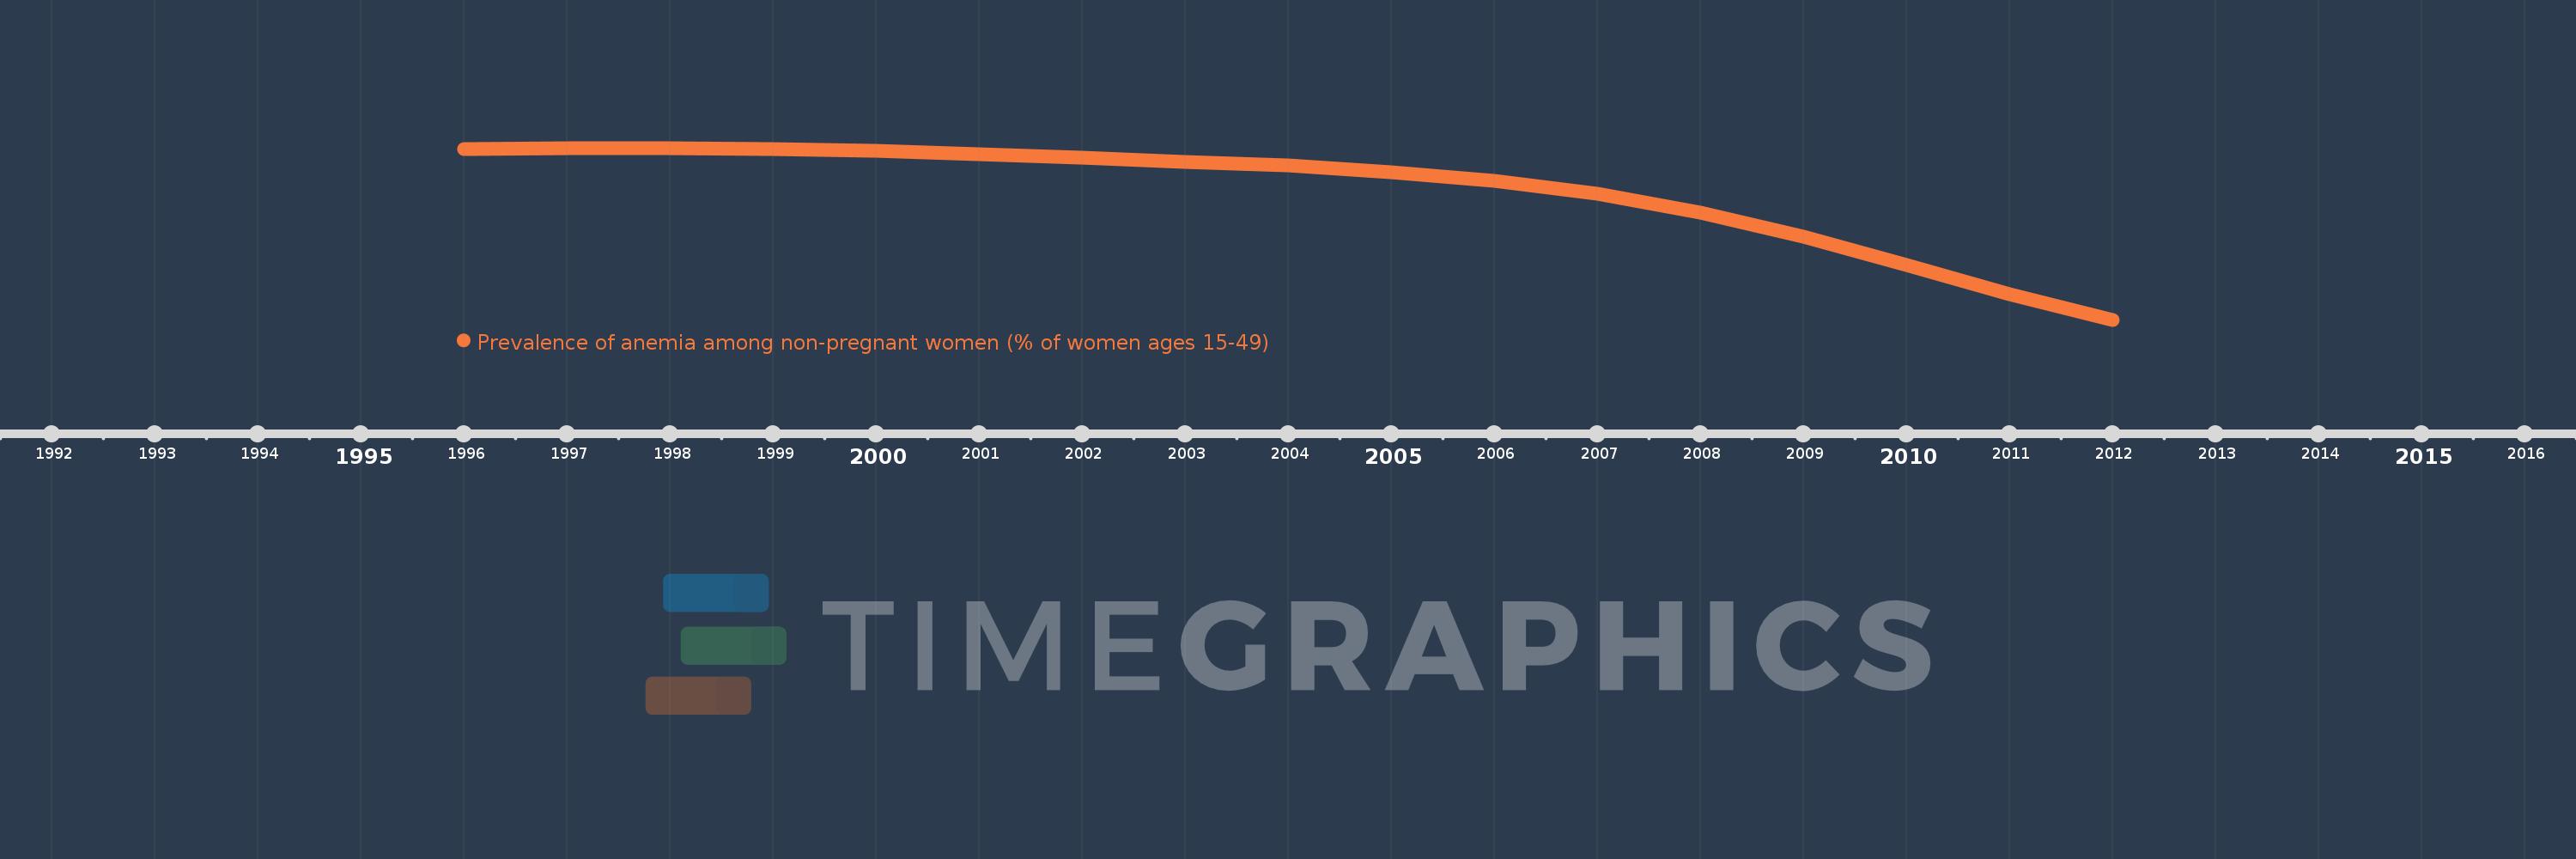
This timeline shows a graph from 1996 to 2012 of Sub-Saharan Africa . No data until 1995. Number of actual observations by date: 17.
Source name:
World Development Indicators
Source organization:
Stevens GA, Finucane MM, De-Regil LM, et al. Global, regional, and national trends in hemoglobin concentration and prevalence of total and severe anemia in children and pregnant and non-pregnant women for 1995-2011: a systematic analysis of population-representative data. The Lancet Global Health 2013; 1(1): e16-e25.
Categories, topics:
Health
Last updated:
apr 23, 2017
Indicators value changes by year
Meaning:
43.206
Minimum:
37.922
jan 1, 2012
Maximum:
45.012
jan 1, 1998
At the date of observation
Value
Absolute change
Change from the previous value
jan 1, 1996
44.98
+44.98
0.0%
jan 1, 1997
44.987
+0.007
0.02%
jan 1, 1998
45.012
+0.026
0.06%
jan 1, 1999
44.967
-0.045
-0.1%
jan 1, 2000
44.893
-0.074
-0.16%
jan 1, 2001
44.762
-0.131
-0.29%
jan 1, 2002
44.596
-0.166
-0.37%
jan 1, 2003
44.447
-0.149
-0.33%
jan 1, 2004
44.277
-0.17
-0.38%
jan 1, 2005
44.025
-0.252
-0.57%
jan 1, 2006
43.652
-0.373
-0.85%
jan 1, 2007
43.11
-0.542
-1.24%
jan 1, 2008
42.342
-0.768
-1.78%
jan 1, 2009
41.367
-0.975
-2.3%
jan 1, 2010
40.193
-1.174
-2.84%
jan 1, 2011
38.962
-1.231
-3.06%
jan 1, 2012
37.922
-1.039
-2.67%
Ranking of countries by current statistics by years