This timeline shows a graph from 1996 to 2012 of OECD members. No data until 1995. Number of actual observations by date: 17.
Source name:
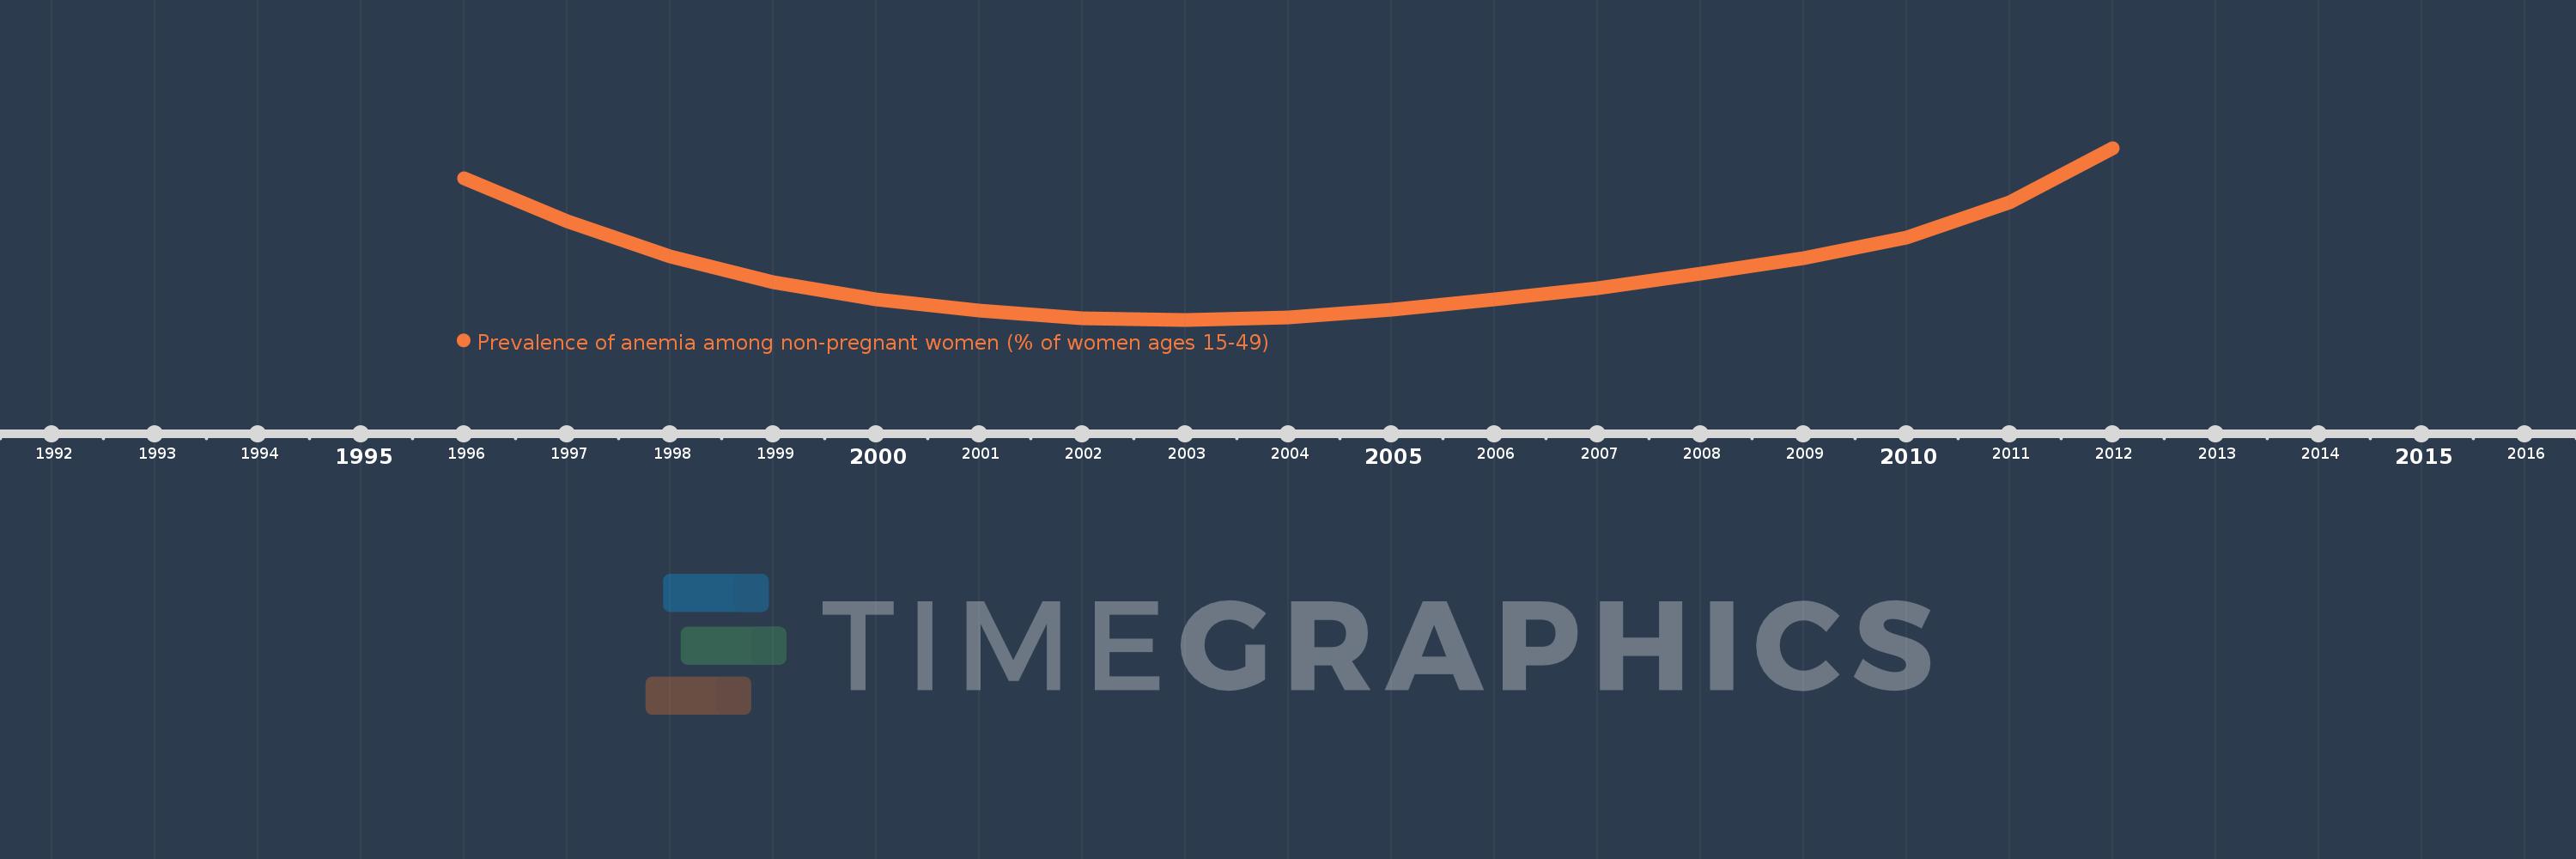
World Development Indicators
Source organization:
Stevens GA, Finucane MM, De-Regil LM, et al. Global, regional, and national trends in hemoglobin concentration and prevalence of total and severe anemia in children and pregnant and non-pregnant women for 1995-2011: a systematic analysis of population-representative data. The Lancet Global Health 2013; 1(1): e16-e25.
Categories, topics:
Health
Last updated:
apr 23, 2017
Indicators value changes by year
Meaning:
15.91
Minimum:
15.327
jan 1, 2003
Maximum:
17.188
jan 1, 2012
At the date of observation
Value
Absolute change
Change from the previous value
jan 1, 1996
16.86
+16.86
0.0%
jan 1, 1997
16.39
-0.47
-2.79%
jan 1, 1998
16.012
-0.377
-2.3%
jan 1, 1999
15.737
-0.276
-1.72%
jan 1, 2000
15.546
-0.191
-1.21%
jan 1, 2001
15.425
-0.121
-0.78%
jan 1, 2002
15.343
-0.082
-0.53%
jan 1, 2003
15.327
-0.017
-0.11%
jan 1, 2004
15.352
+0.025
0.17%
jan 1, 2005
15.435
+0.083
0.54%
jan 1, 2006
15.548
+0.113
0.73%
jan 1, 2007
15.67
+0.122
0.78%
jan 1, 2008
15.829
+0.159
1.01%
jan 1, 2009
15.99
+0.161
1.02%
jan 1, 2010
16.215
+0.225
1.4%
jan 1, 2011
16.602
+0.387
2.39%
jan 1, 2012
17.188
+0.587
3.53%
Ranking of countries by current statistics by years