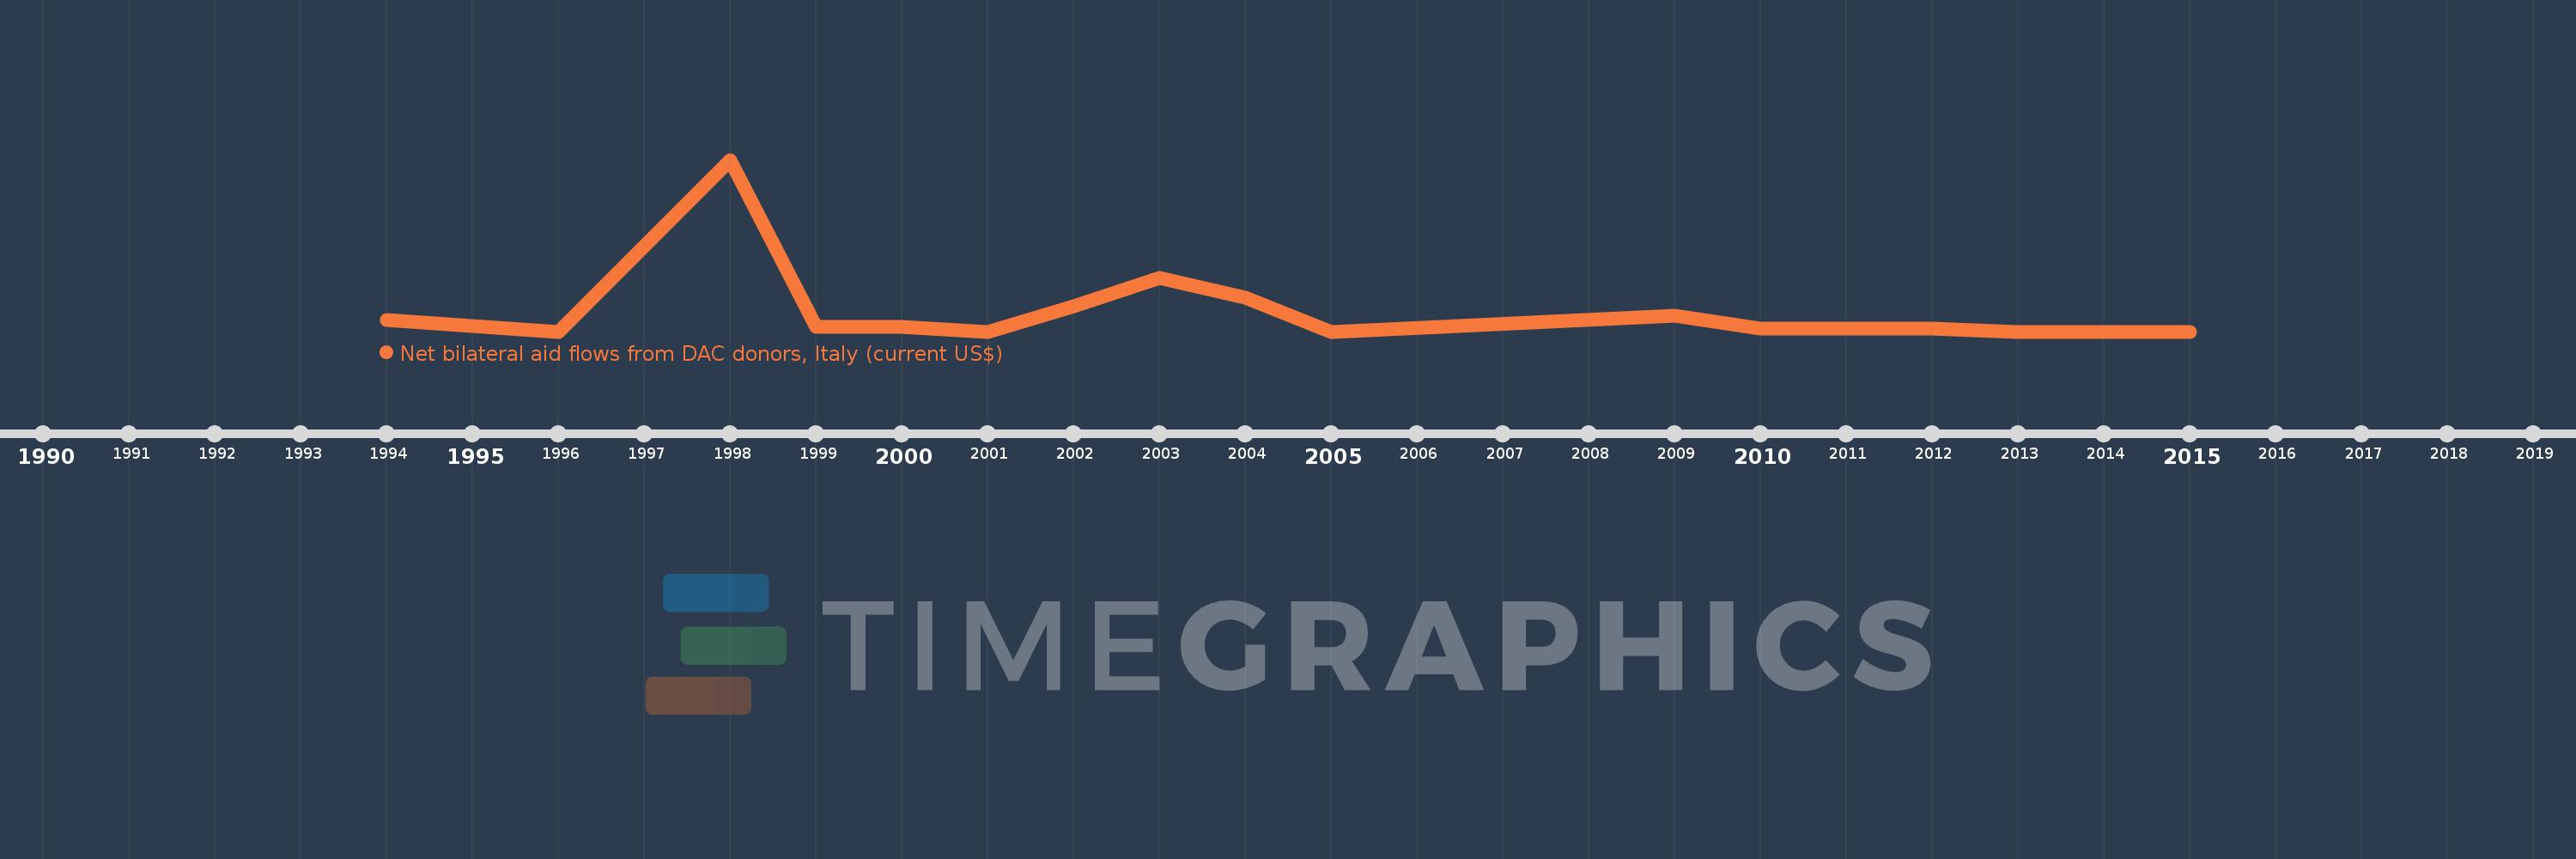
This timeline shows a graph from 1994 to 2015 of Uzbekistan. No data until 1993. Number of actual observations by date: 16.
Source name:
World Development Indicators
Source organization:
Development Assistance Committee of the Organisation for Economic Co-operation and Development, Geographical Distribution of Financial Flows to Developing Countries, Development Co-operation Report, and International Development Statistics database. Data are available online at: www.oecd.org/dac/stats/idsonline.
Categories, topics:
Aid Effectiveness
Last updated:
apr 23, 2017
Indicators value changes by year
Meaning:
148.125K
Minimum:
10.0K
jan 1, 1996
Maximum:
1.17 mln
jan 1, 1998
At the date of observation
Value
Absolute change
Change from the previous value
jan 1, 1994
90.0K
+90.0K
0.0%
jan 1, 1996
10.0K
-80.0K
-88.89%
jan 1, 1998
1.17 mln
+1.16 mln
11.6K%
jan 1, 1999
40.0K
-1.13 mln
-96.58%
jan 1, 2000
40.0K
0.0
0.0%
jan 1, 2001
10.0K
-30.0K
-75.0%
jan 1, 2002
180.0K
+170.0K
1.7K%
jan 1, 2003
370.0K
+190.0K
105.56%
jan 1, 2004
240.0K
-130.0K
-35.14%
jan 1, 2005
10.0K
-230.0K
-95.83%
jan 1, 2009
120.0K
+110.0K
1.1K%
jan 1, 2010
30.0K
-90.0K
-75.0%
jan 1, 2012
30.0K
0.0
0.0%
jan 1, 2013
10.0K
-20.0K
-66.67%
jan 1, 2014
10.0K
0.0
0.0%
jan 1, 2015
10.0K
0.0
0.0%
Ranking of countries by current statistics by years