29
/
en
AIzaSyAYiBZKx7MnpbEhh9jyipgxe19OcubqV5w
April 1, 2024
108804
Comoros
COM
true
2
1
Net bilateral aid flows from DAC donors, Italy (current US$)
2015,2012,2008,2005,1999,1995,1994,1990,1989,1988,1985,1984,1982,1981,1980,1979,1978
Download
Global statistics library →Comoros →

Net bilateral aid flows from DAC donors, Italy (current US$)

This statistics in other country:
AfghanistanAlbaniaAlgeriaAngolaAntigua and BarbudaArab WorldArgentinaArmeniaAzerbaijanBahamas, TheBangladeshBarbadosBelarusBelizeBeninBhutanBoliviaBosnia and HerzegovinaBotswanaBrazilBulgariaBurkina FasoBurundiCabo VerdeCambodiaCameroonCaribbean small statesCentral African RepublicCentral Europe and the BalticsChadChileChinaColombiaComorosCongo, Dem. Rep.Congo, Rep.Costa RicaCote d'IvoireCroatiaCubaCyprusCzech RepublicDjiboutiDominicaDominican RepublicEast Asia & PacificEast Asia & Pacific (excluding high income)East Asia & Pacific (IDA & IBRD countries)EcuadorEgypt, Arab Rep.El SalvadorEquatorial GuineaEritreaEstoniaEthiopiaEuro areaEurope & Central AsiaEurope & Central Asia (excluding high income)Europe & Central Asia (IDA & IBRD countries)European UnionFijiFragile and conflict affected situationsGabonGambia, TheGeorgiaGhanaGuatemalaGuineaGuinea-BissauGuyanaHaitiHeavily indebted poor countries (HIPC)High incomeHondurasHong Kong SAR, ChinaHungaryIBRD onlyIDA & IBRD totalIDA blendIDA onlyIDA totalIndiaIndonesiaIran, Islamic Rep.IraqIsraelJamaicaJordanKazakhstanKenyaKiribatiKorea, Dem. People’s Rep.Korea, Rep.KosovoKuwaitKyrgyz RepublicLao PDRLatin America & Caribbean Latin America & Caribbean (excluding high income)Latin America & the Caribbean (IDA & IBRD countries)LatviaLeast developed countries: UN classificationLebanonLesothoLiberiaLibyaLithuaniaLow & middle incomeLow incomeLower middle incomeMacedonia, FYRMadagascarMalawiMalaysiaMaldivesMaliMaltaMarshall IslandsMauritaniaMauritiusMexicoMiddle East & North AfricaMiddle East & North Africa (excluding high income)Middle East & North Africa (IDA & IBRD countries)Middle incomeMoldovaMongoliaMontenegroMoroccoMozambiqueMyanmarNamibiaNauruNepalNicaraguaNigerNigeriaOECD membersOmanOther small statesPacific island small statesPakistanPalauPanamaPapua New GuineaParaguayPeruPhilippinesPolandRomaniaRussian FederationRwandaSamoaSao Tome and PrincipeSaudi ArabiaSenegalSerbiaSeychellesSierra LeoneSingaporeSlovak RepublicSloveniaSmall statesSolomon IslandsSomaliaSouth AfricaSouth AsiaSouth Asia (IDA & IBRD)South SudanSri LankaSt. Kitts and NevisSt. LuciaSt. Vincent and the GrenadinesSub-Saharan Africa Sub-Saharan Africa (excluding high income)Sub-Saharan Africa (IDA & IBRD countries)SudanSurinameSwazilandSyrian Arab RepublicTajikistanTanzaniaThailandTimor-LesteTogoTongaTrinidad and TobagoTunisiaTurkeyTurkmenistanTuvaluUgandaUkraineUnited Arab EmiratesUpper middle incomeUruguayUzbekistanVanuatuVenezuela, RBVietnamWest Bank and GazaWorldYemen, Rep.ZambiaZimbabwe
Timeline:
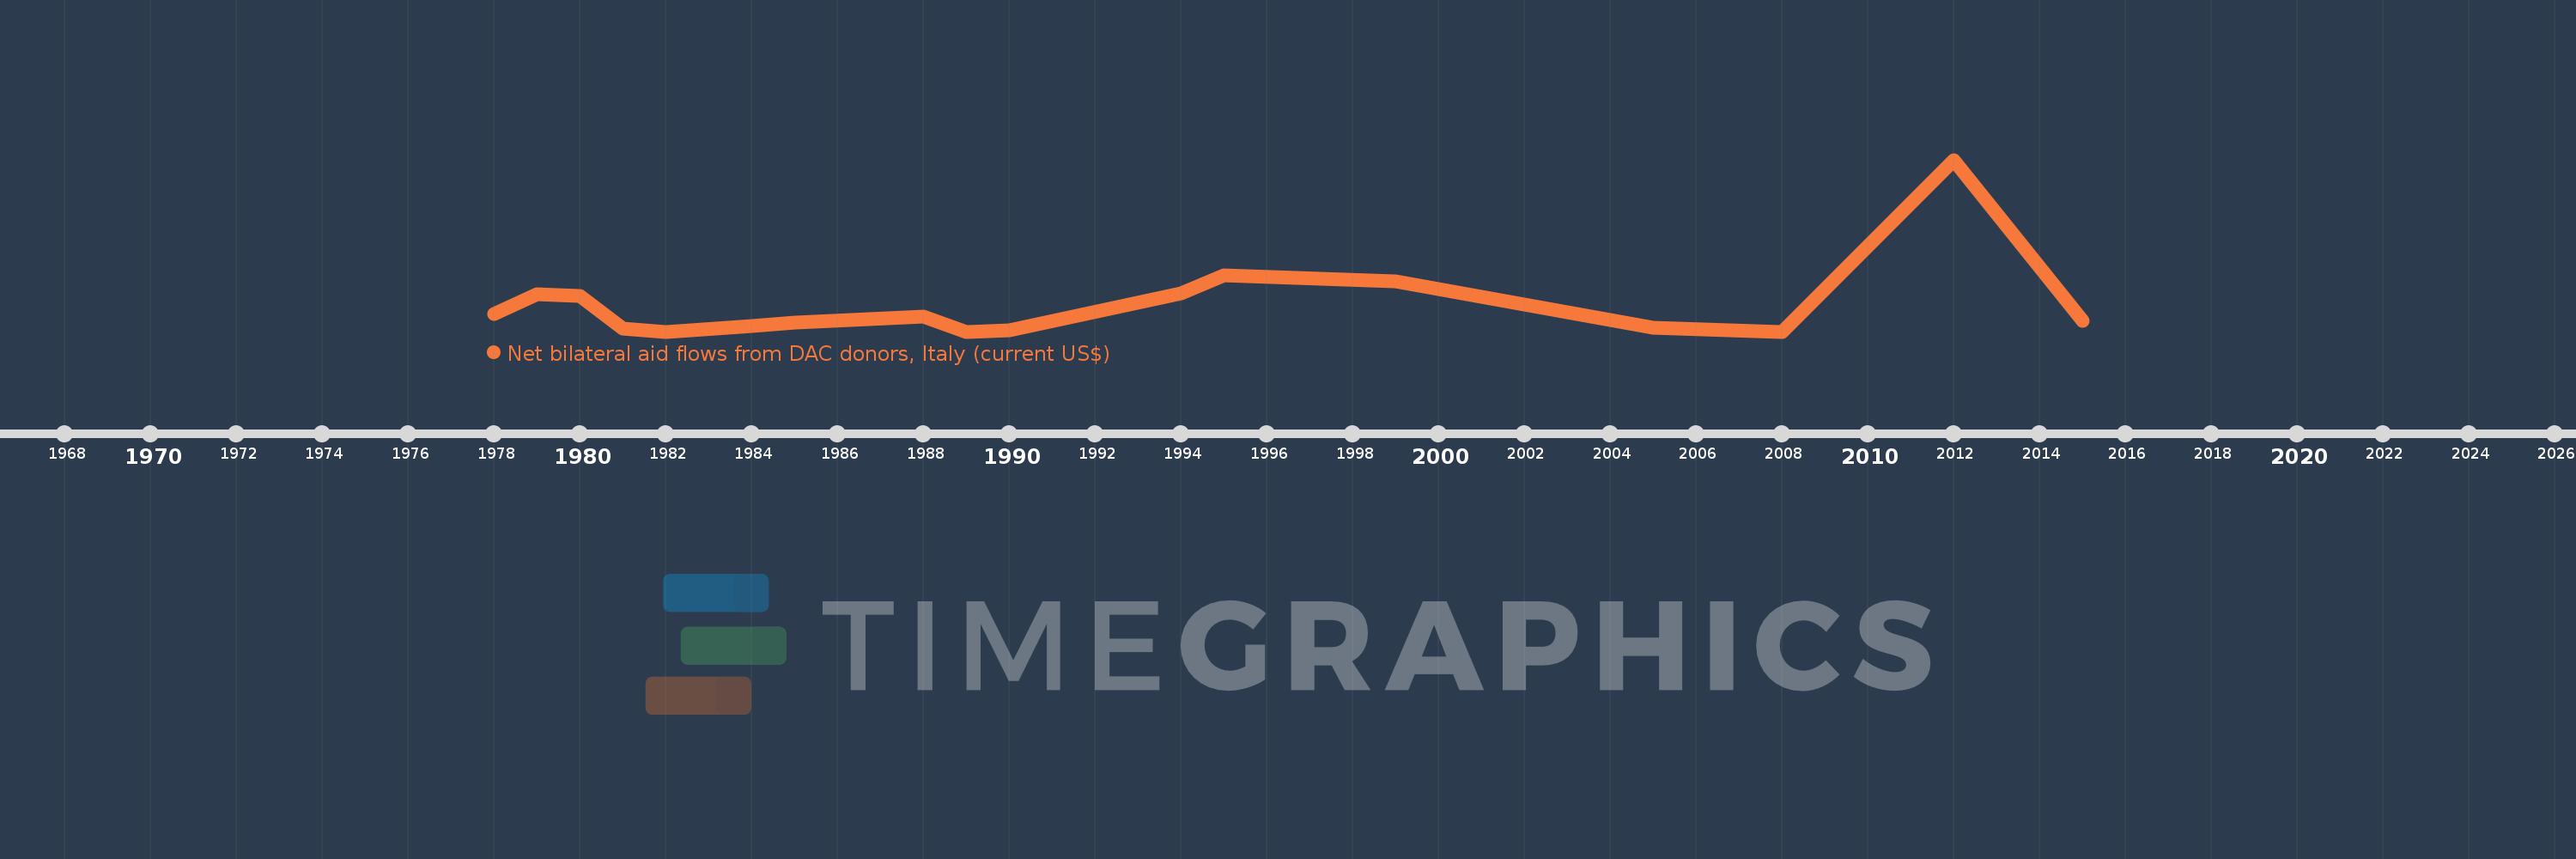
This timeline shows a graph from 1978 to 2015 of Comoros. No data until 1977. Number of actual observations by date: 17.
Source name:
World Development Indicators
Source organization:
Development Assistance Committee of the Organisation for Economic Co-operation and Development, Geographical Distribution of Financial Flows to Developing Countries, Development Co-operation Report, and International Development Statistics database. Data are available online at: www.oecd.org/dac/stats/idsonline.
Categories, topics:
Aid Effectiveness
Last updated:
apr 23, 2017
Indicators value changes by year
Mean:
211.176K
Minimum:
10.0K
jan 1, 1982
Maximum:
1.3 mln
jan 1, 2012
At the date of observation
Value
Absolute change
Change from previous value
jan 1, 1978
140.0K
+140.0K
0.0%
jan 1, 1979
290.0K
+150.0K
107.14%
jan 1, 1980
280.0K
-10.0K
-3.45%
jan 1, 1981
30.0K
-250.0K
-89.29%
jan 1, 1982
10.0K
-20.0K
-66.67%
jan 1, 1984
50.0K
+40.0K
400.0%
jan 1, 1985
80.0K
+30.0K
60.0%
jan 1, 1988
120.0K
+40.0K
50.0%
jan 1, 1989
10.0K
-110.0K
-91.67%
jan 1, 1990
20.0K
+10.0K
100.0%
jan 1, 1994
300.0K
+280.0K
1.4K%
jan 1, 1995
430.0K
+130.0K
43.33%
jan 1, 1999
390.0K
-40.0K
-9.3%
jan 1, 2005
40.0K
-350.0K
-89.74%
jan 1, 2008
10.0K
-30.0K
-75.0%
jan 1, 2012
1.3 mln
+1.29 mln
12.9K%
jan 1, 2015
90.0K
-1.21 mln
-93.08%
Ranking of countries by current statistics by years

Comments:

Send
PremiumAbout & FeedbackTermsPrivacy
logo
© 2022 Selected Technologies LLC – Morgan Hill, California