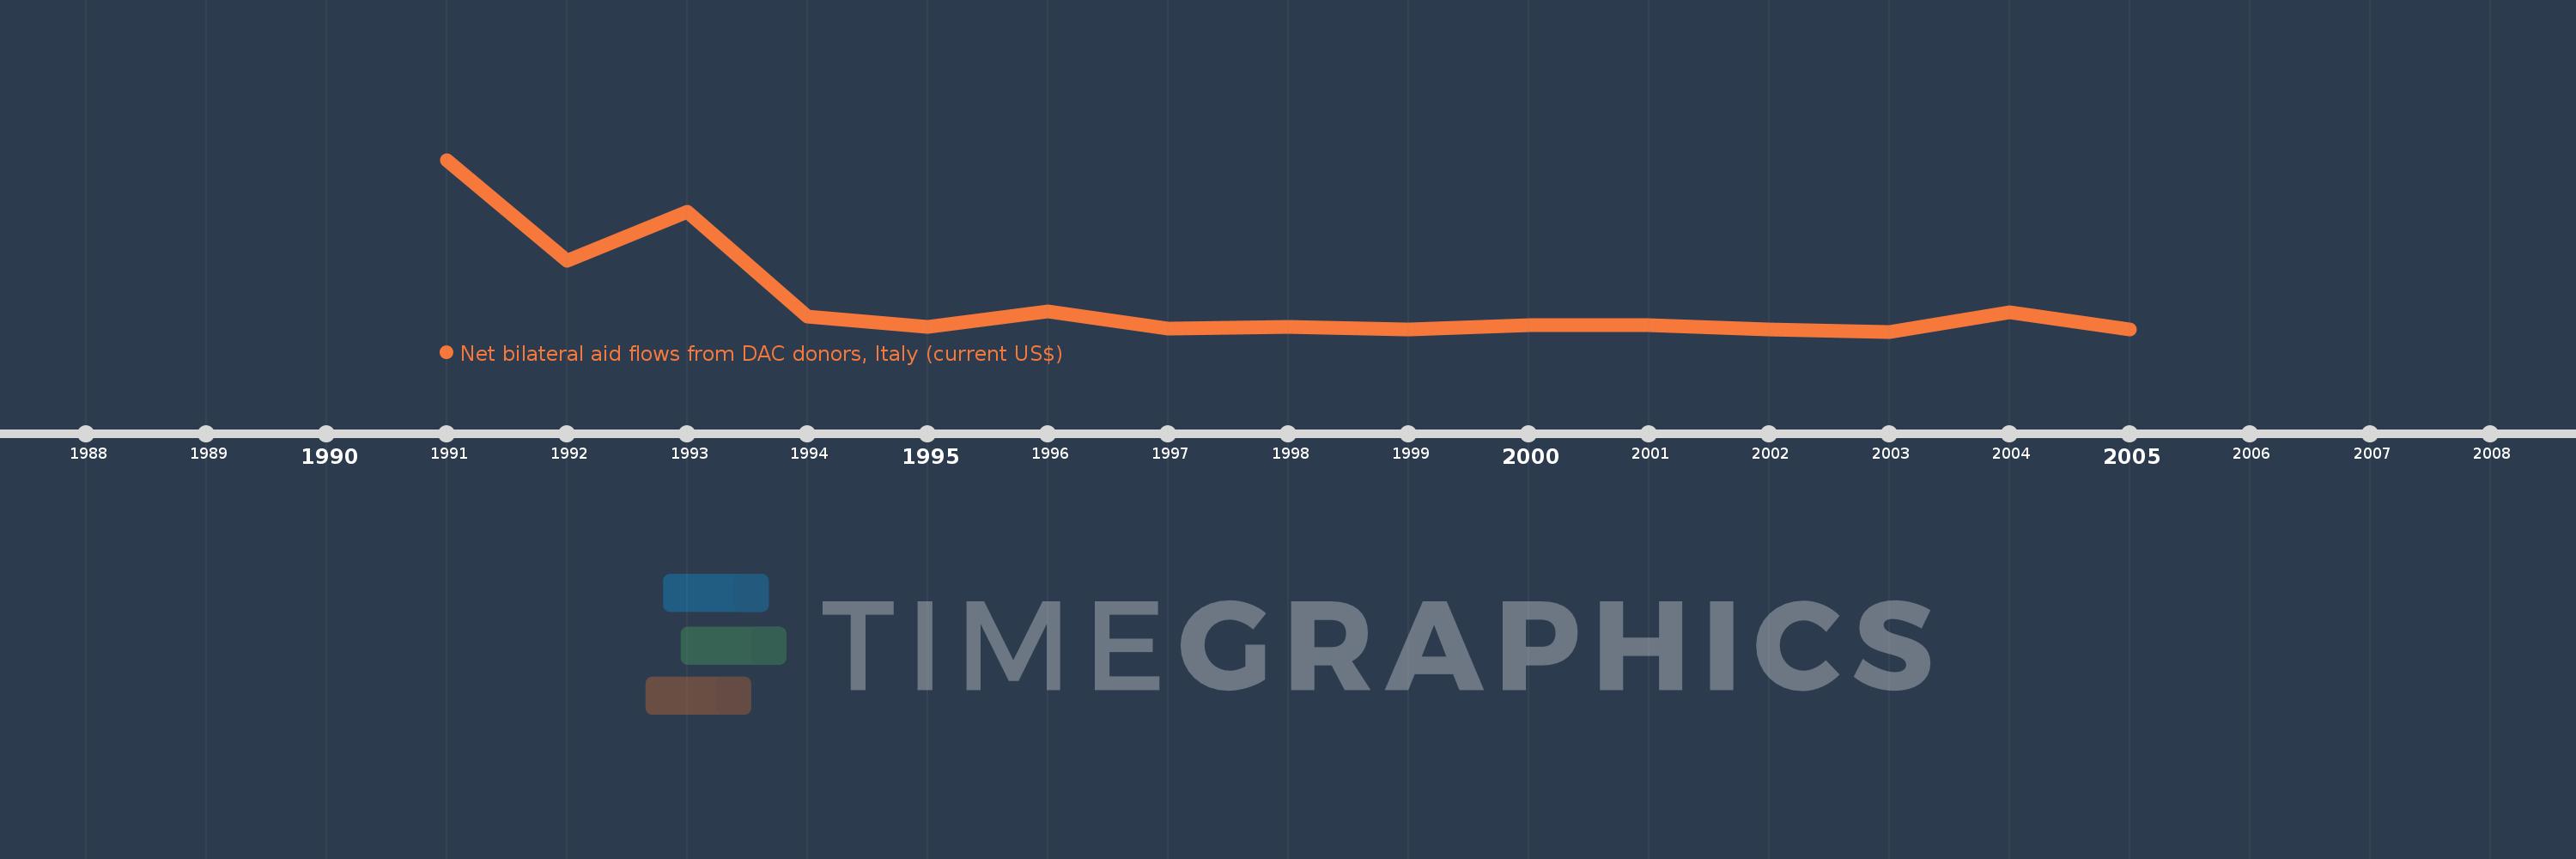
This timeline shows a graph from 1991 to 2005 of Poland. No data until 1990. Number of actual observations by date: 15.
Source name:
World Development Indicators
Source organization:
Development Assistance Committee of the Organisation for Economic Co-operation and Development, Geographical Distribution of Financial Flows to Developing Countries, Development Co-operation Report, and International Development Statistics database. Data are available online at: www.oecd.org/dac/stats/idsonline.
Categories, topics:
Aid Effectiveness
Last updated:
apr 23, 2017
Indicators value changes by year
Meaning:
11.559 mln
Minimum:
-810.0K
jan 1, 2003
Maximum:
70.07 mln
jan 1, 1991
At the date of observation
Value
Absolute change
Change from the previous value
jan 1, 1991
70.07 mln
+70.07 mln
0.0%
jan 1, 1992
28.34 mln
-41.73 mln
-59.55%
jan 1, 1993
48.74 mln
+20.4 mln
71.98%
jan 1, 1994
5.46 mln
-43.28 mln
-88.8%
jan 1, 1995
1.15 mln
-4.31 mln
-78.94%
jan 1, 1996
7.44 mln
+6.29 mln
546.96%
jan 1, 1997
480.0K
-6.96 mln
-93.55%
jan 1, 1998
1.02 mln
+540.0K
112.5%
jan 1, 1999
190.0K
-830.0K
-81.37%
jan 1, 2000
1.97 mln
+1.78 mln
936.84%
jan 1, 2001
1.87 mln
-100.0K
-5.08%
jan 1, 2002
190.0K
-1.68 mln
-89.84%
jan 1, 2003
-810.0K
-1000.0K
-526.32%
jan 1, 2004
7.22 mln
+8.03 mln
-991.36%
jan 1, 2005
60.0K
-7.16 mln
-99.17%
Ranking of countries by current statistics by years