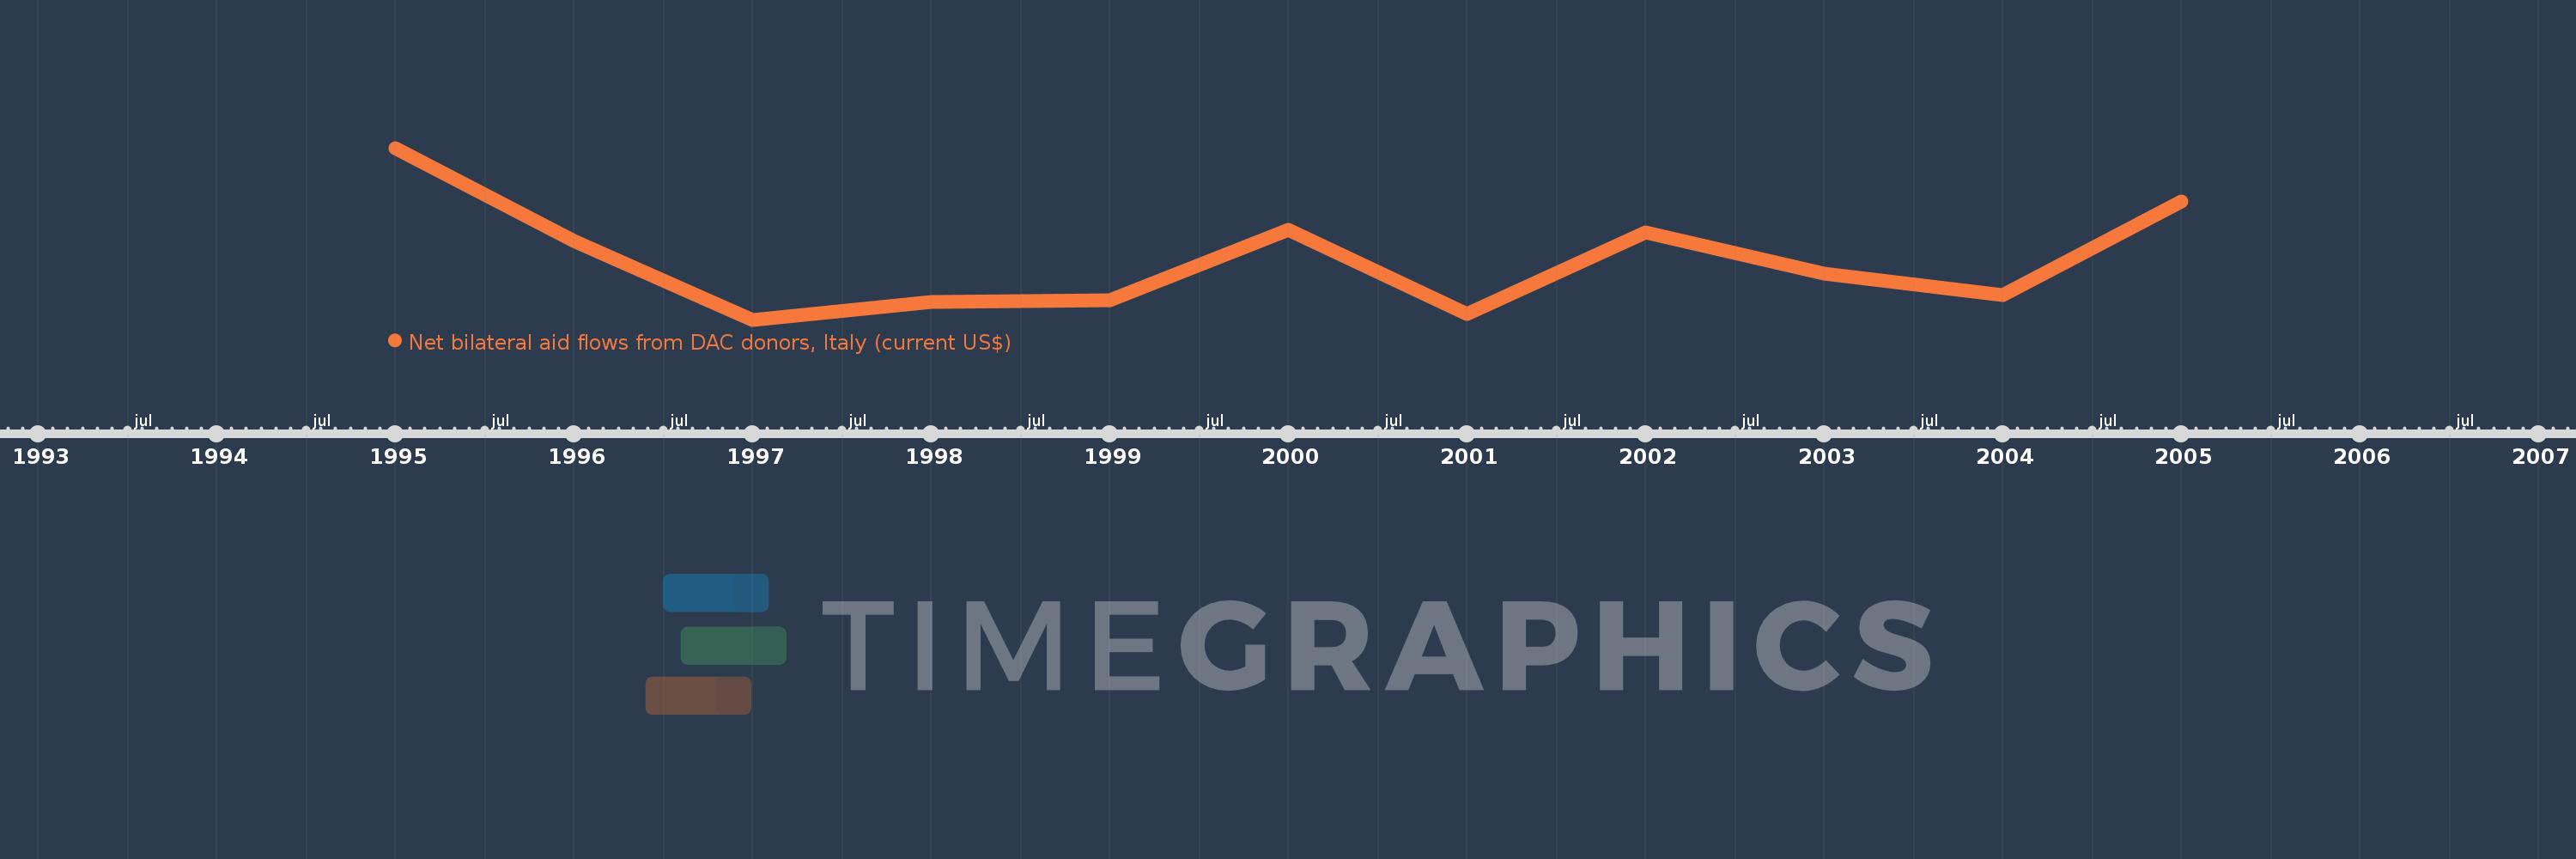
This timeline shows a graph from 1995 to 2005 of Slovenia. No data until 1994. Number of actual observations by date: 11.
Source name:
World Development Indicators
Source organization:
Development Assistance Committee of the Organisation for Economic Co-operation and Development, Geographical Distribution of Financial Flows to Developing Countries, Development Co-operation Report, and International Development Statistics database. Data are available online at: www.oecd.org/dac/stats/idsonline.
Categories, topics:
Aid Effectiveness
Last updated:
apr 23, 2017
Indicators value changes by year
Meaning:
-650.909K
Minimum:
-1.49 mln
jan 1, 1997
Maximum:
910.0K
jan 1, 1995
At the date of observation
Value
Absolute change
Change from the previous value
jan 1, 1995
910.0K
+910.0K
0.0%
jan 1, 1996
-390.0K
-1.3 mln
-142.86%
jan 1, 1997
-1.49 mln
-1.1 mln
282.05%
jan 1, 1998
-1.24 mln
+250.0K
-16.78%
jan 1, 1999
-1.22 mln
+20.0K
-1.61%
jan 1, 2000
-230.0K
+990.0K
-81.15%
jan 1, 2001
-1.41 mln
-1.18 mln
513.04%
jan 1, 2002
-270.0K
+1.14 mln
-80.85%
jan 1, 2003
-840.0K
-570.0K
211.11%
jan 1, 2004
-1.14 mln
-300.0K
35.71%
jan 1, 2005
160.0K
+1.3 mln
-114.04%
Ranking of countries by current statistics by years