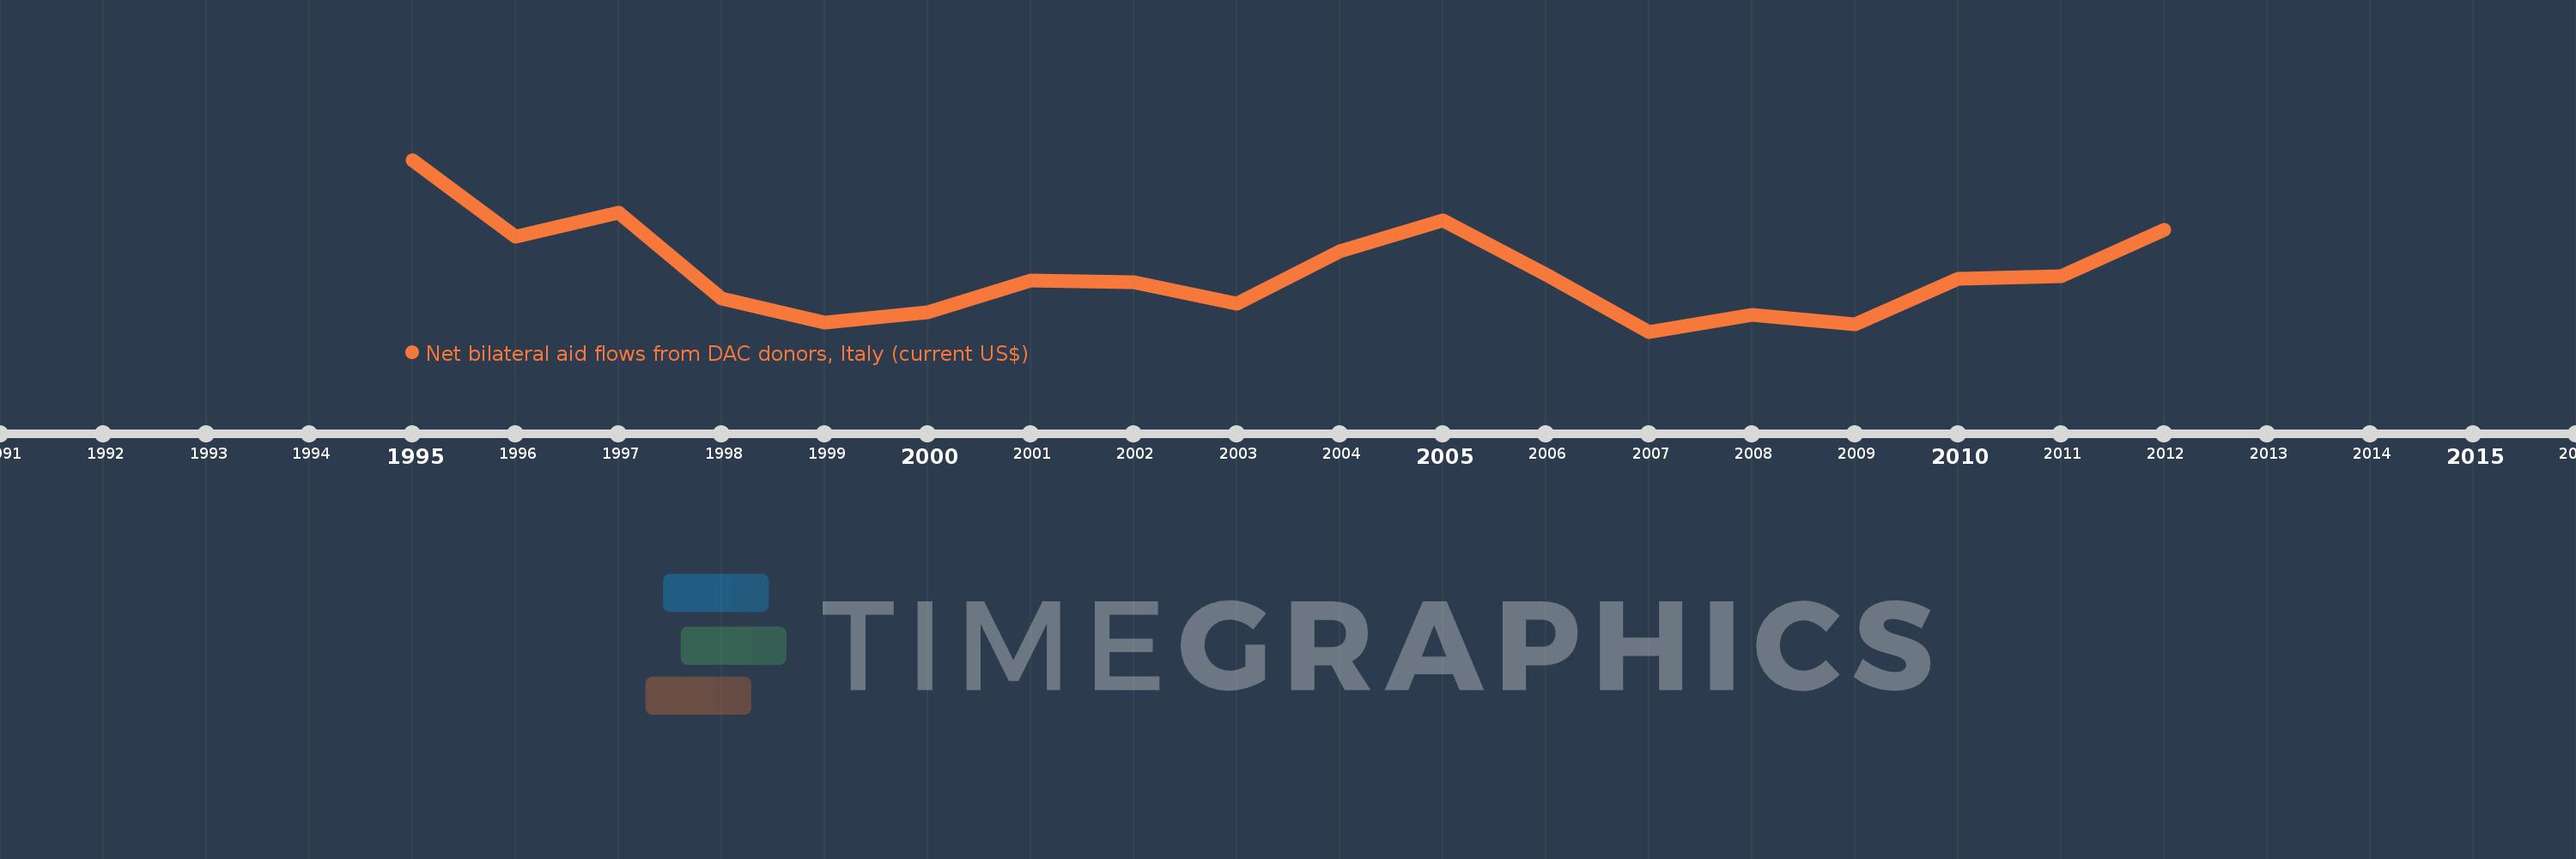
This timeline shows a graph from 1995 to 2012 of Croatia. No data until 1994. Number of actual observations by date: 18.
Source name:
World Development Indicators
Source organization:
Development Assistance Committee of the Organisation for Economic Co-operation and Development, Geographical Distribution of Financial Flows to Developing Countries, Development Co-operation Report, and International Development Statistics database. Data are available online at: www.oecd.org/dac/stats/idsonline.
Categories, topics:
Aid Effectiveness
Last updated:
apr 23, 2017
Indicators value changes by year
Meaning:
-1.476 mln
Minimum:
-3.89 mln
jan 1, 2007
Maximum:
3.16 mln
jan 1, 1995
At the date of observation
Value
Absolute change
Change from the previous value
jan 1, 1995
3.16 mln
+3.16 mln
0.0%
jan 1, 1996
20.0K
-3.14 mln
-99.37%
jan 1, 1997
980.0K
+960.0K
4.8K%
jan 1, 1998
-2.54 mln
-3.52 mln
-359.18%
jan 1, 1999
-3.53 mln
-990.0K
38.98%
jan 1, 2000
-3.08 mln
+450.0K
-12.75%
jan 1, 2001
-1.8 mln
+1.28 mln
-41.56%
jan 1, 2002
-1.86 mln
-60.0K
3.33%
jan 1, 2003
-2.75 mln
-890.0K
47.85%
jan 1, 2004
-580.0K
+2.17 mln
-78.91%
jan 1, 2005
670.0K
+1.25 mln
-215.52%
jan 1, 2006
-1.53 mln
-2.2 mln
-328.36%
jan 1, 2007
-3.89 mln
-2.36 mln
154.25%
jan 1, 2008
-3.19 mln
+700.0K
-17.99%
jan 1, 2009
-3.59 mln
-400.0K
12.54%
jan 1, 2010
-1.72 mln
+1.87 mln
-52.09%
jan 1, 2011
-1.61 mln
+110.0K
-6.4%
jan 1, 2012
280.0K
+1.89 mln
-117.39%
Ranking of countries by current statistics by years