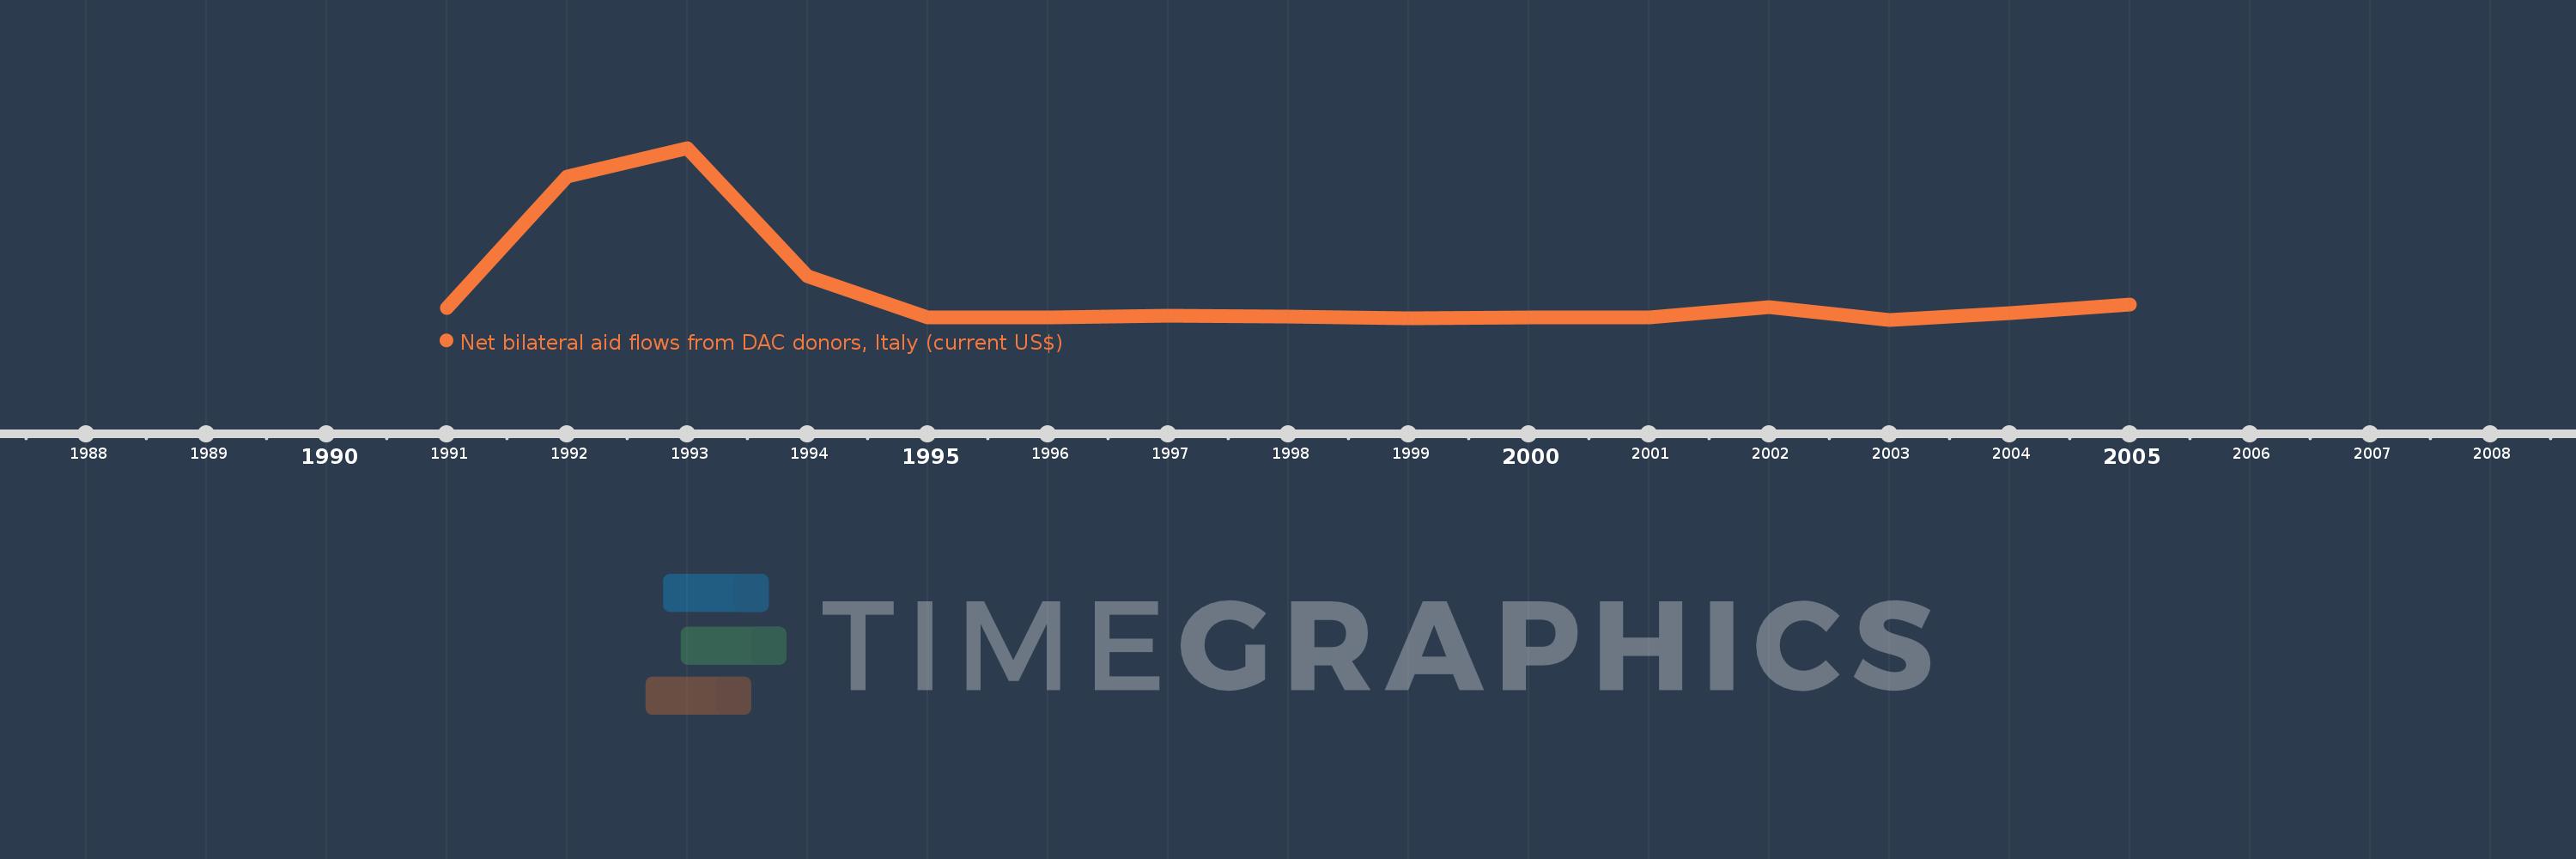
This timeline shows a graph from 1991 to 2005 of Romania. No data until 1990. Number of actual observations by date: 15.
Source name:
World Development Indicators
Source organization:
Development Assistance Committee of the Organisation for Economic Co-operation and Development, Geographical Distribution of Financial Flows to Developing Countries, Development Co-operation Report, and International Development Statistics database. Data are available online at: www.oecd.org/dac/stats/idsonline.
Categories, topics:
Aid Effectiveness
Last updated:
apr 23, 2017
Indicators value changes by year
Meaning:
6.017 mln
Minimum:
10.0K
jan 1, 2003
Maximum:
36.67 mln
jan 1, 1993
At the date of observation
Value
Absolute change
Change from the previous value
jan 1, 1991
2.49 mln
+2.49 mln
0.0%
jan 1, 1992
30.61 mln
+28.12 mln
1.13K%
jan 1, 1993
36.67 mln
+6.06 mln
19.8%
jan 1, 1994
9.37 mln
-27.3 mln
-74.45%
jan 1, 1995
560.0K
-8.81 mln
-94.02%
jan 1, 1996
420.0K
-140.0K
-25.0%
jan 1, 1997
840.0K
+420.0K
100.0%
jan 1, 1998
660.0K
-180.0K
-21.43%
jan 1, 1999
410.0K
-250.0K
-37.88%
jan 1, 2000
540.0K
+130.0K
31.71%
jan 1, 2001
460.0K
-80.0K
-14.81%
jan 1, 2002
2.69 mln
+2.23 mln
484.78%
jan 1, 2003
10.0K
-2.68 mln
-99.63%
jan 1, 2004
1.36 mln
+1.35 mln
13.5K%
jan 1, 2005
3.17 mln
+1.81 mln
133.09%
Ranking of countries by current statistics by years