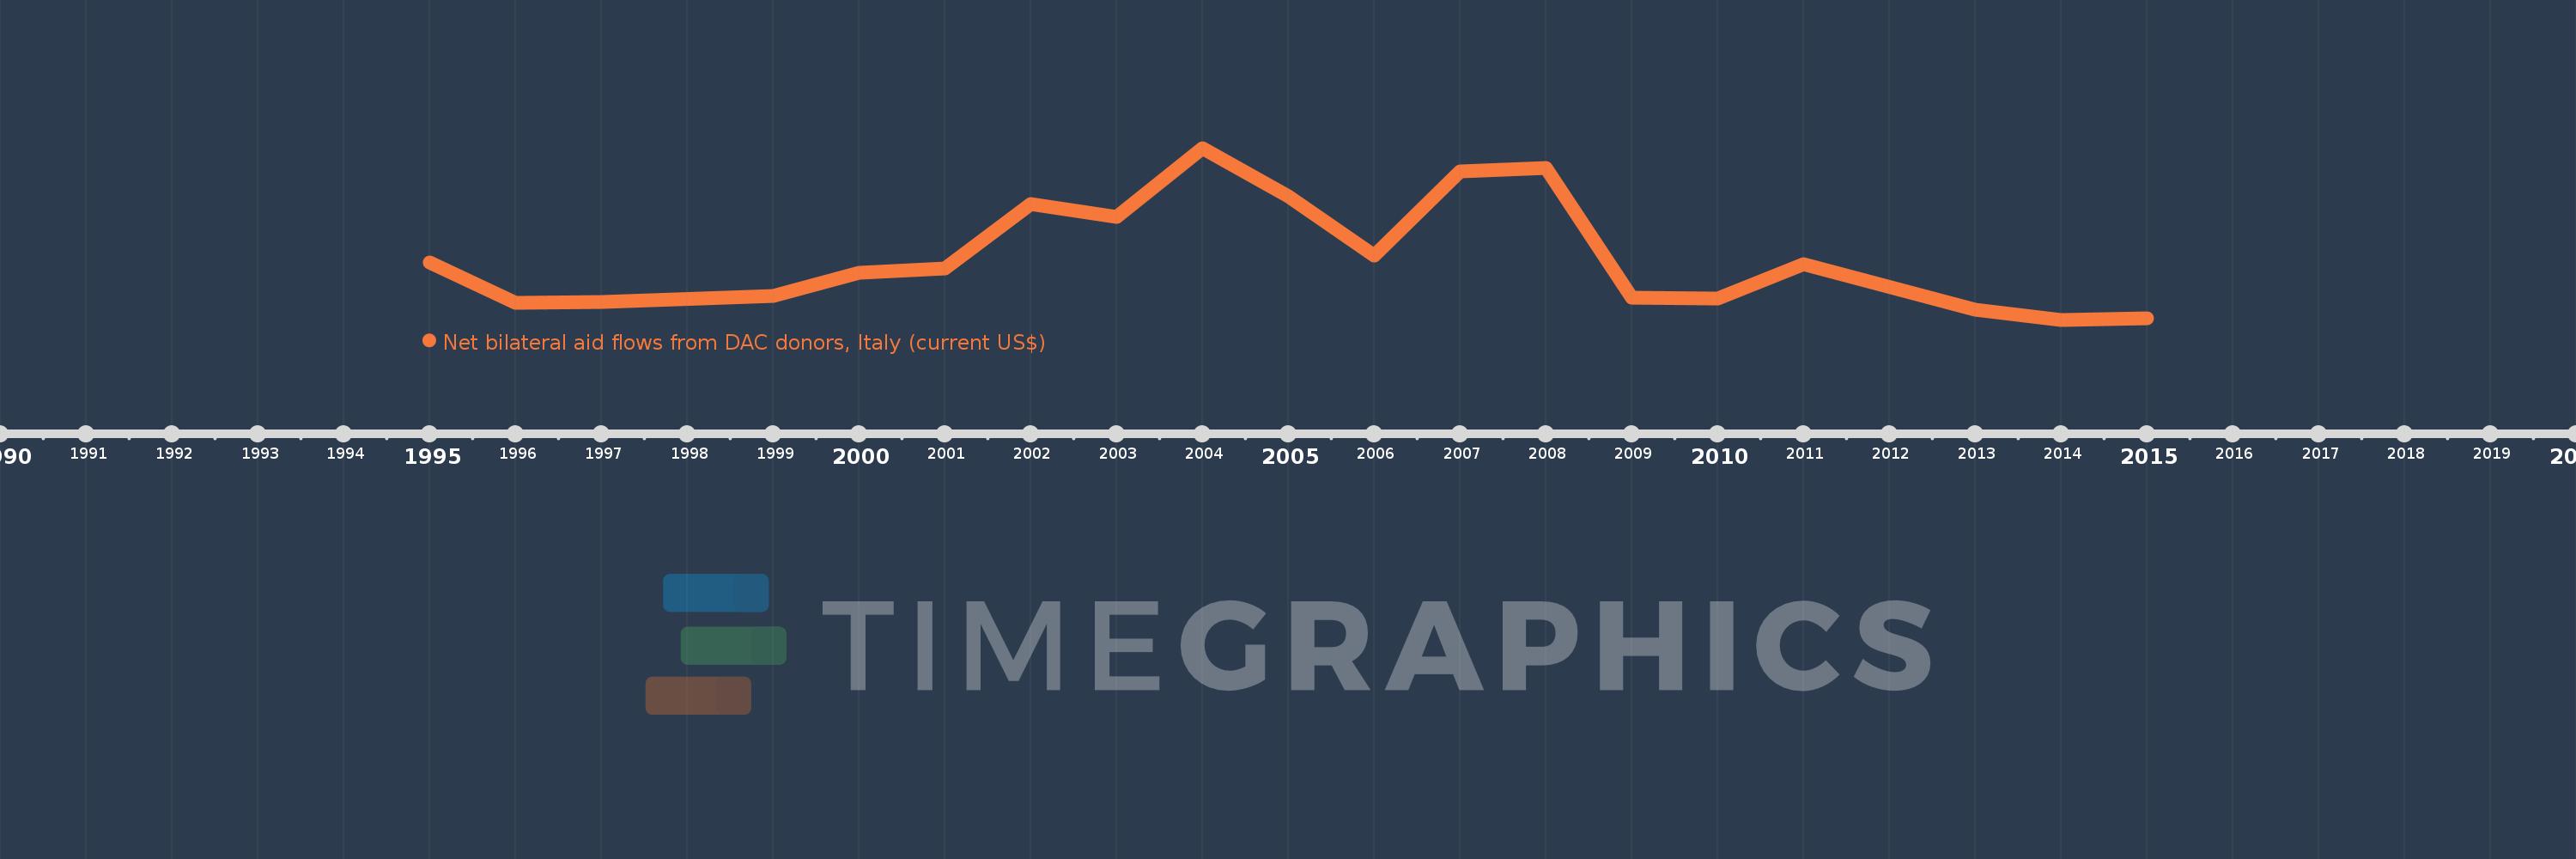
This timeline shows a graph from 1995 to 2015 of Macedonia, FYR. No data until 1994. Number of actual observations by date: 19.
Source name:
World Development Indicators
Source organization:
Development Assistance Committee of the Organisation for Economic Co-operation and Development, Geographical Distribution of Financial Flows to Developing Countries, Development Co-operation Report, and International Development Statistics database. Data are available online at: www.oecd.org/dac/stats/idsonline.
Categories, topics:
Aid Effectiveness
Last updated:
apr 23, 2017
Indicators value changes by year
Meaning:
2.545 mln
Minimum:
-890.0K
jan 1, 2014
Maximum:
8.43 mln
jan 1, 2004
At the date of observation
Value
Absolute change
Change from the previous value
jan 1, 1995
2.22 mln
+2.22 mln
0.0%
jan 1, 1996
20.0K
-2.2 mln
-99.1%
jan 1, 1997
60.0K
+40.0K
200.0%
jan 1, 1999
410.0K
+350.0K
583.33%
jan 1, 2000
1.68 mln
+1.27 mln
309.76%
jan 1, 2001
1.9 mln
+220.0K
13.1%
jan 1, 2002
5.4 mln
+3.5 mln
184.21%
jan 1, 2003
4.68 mln
-720.0K
-13.33%
jan 1, 2004
8.43 mln
+3.75 mln
80.13%
jan 1, 2005
5.82 mln
-2.61 mln
-30.96%
jan 1, 2006
2.59 mln
-3.23 mln
-55.5%
jan 1, 2007
7.16 mln
+4.57 mln
176.45%
jan 1, 2008
7.34 mln
+180.0K
2.51%
jan 1, 2009
330.0K
-7.01 mln
-95.5%
jan 1, 2010
250.0K
-80.0K
-24.24%
jan 1, 2011
2.12 mln
+1.87 mln
748.0%
jan 1, 2013
-350.0K
-2.47 mln
-116.51%
jan 1, 2014
-890.0K
-540.0K
154.29%
jan 1, 2015
-820.0K
+70.0K
-7.87%
Ranking of countries by current statistics by years