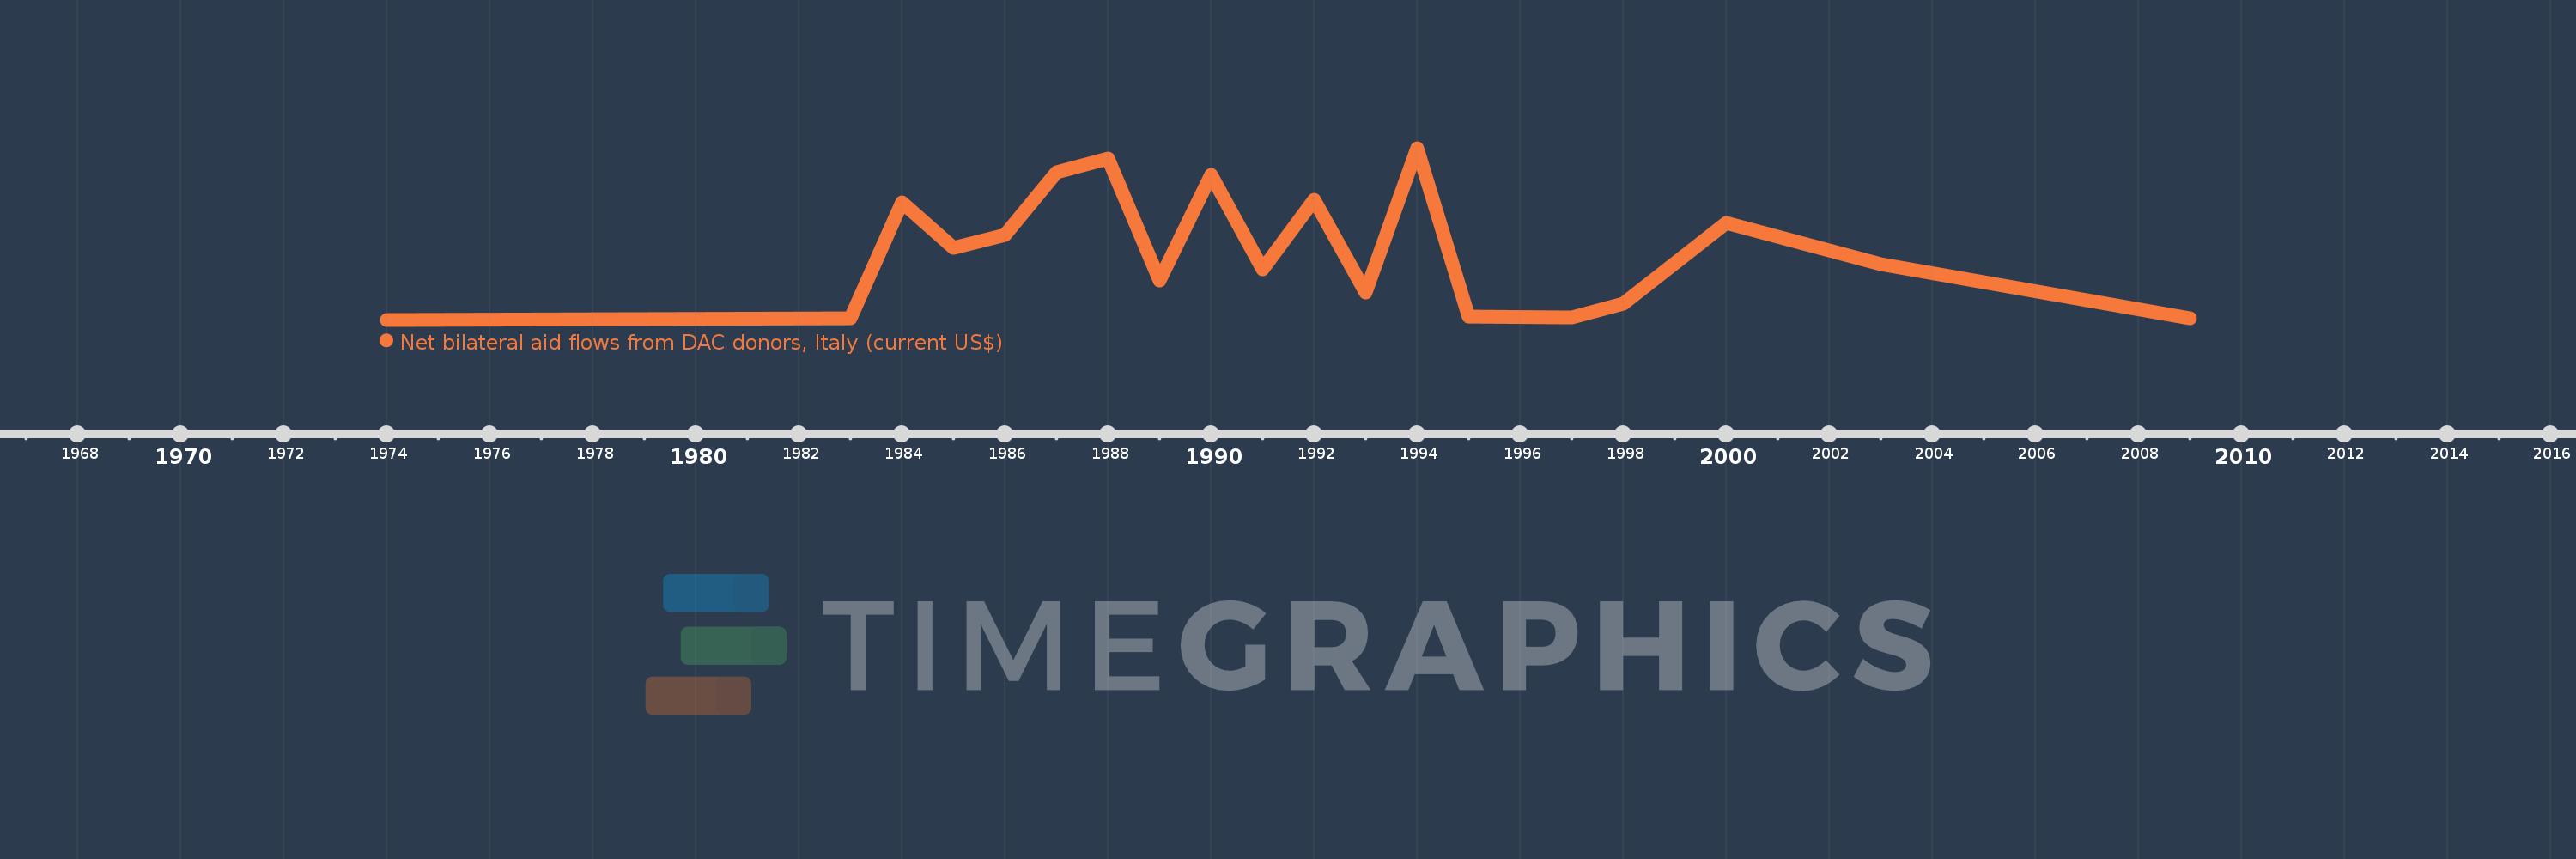
This timeline shows a graph from 1974 to 2009 of Lesotho. No data until 1973. Number of actual observations by date: 19.
Source name:
World Development Indicators
Source organization:
Development Assistance Committee of the Organisation for Economic Co-operation and Development, Geographical Distribution of Financial Flows to Developing Countries, Development Co-operation Report, and International Development Statistics database. Data are available online at: www.oecd.org/dac/stats/idsonline.
Categories, topics:
Aid Effectiveness
Last updated:
apr 23, 2017
Indicators value changes by year
Meaning:
596.842K
Minimum:
10.0K
jan 1, 1974
Maximum:
1.47 mln
jan 1, 1994
At the date of observation
Value
Absolute change
Change from the previous value
jan 1, 1974
10.0K
+10.0K
0.0%
jan 1, 1983
20.0K
+10.0K
100.0%
jan 1, 1984
1.01 mln
+990.0K
4.95K%
jan 1, 1985
620.0K
-390.0K
-38.61%
jan 1, 1986
730.0K
+110.0K
17.74%
jan 1, 1987
1.26 mln
+530.0K
72.6%
jan 1, 1988
1.38 mln
+120.0K
9.52%
jan 1, 1989
340.0K
-1.04 mln
-75.36%
jan 1, 1990
1.24 mln
+900.0K
264.71%
jan 1, 1991
440.0K
-800.0K
-64.52%
jan 1, 1992
1.03 mln
+590.0K
134.09%
jan 1, 1993
240.0K
-790.0K
-76.7%
jan 1, 1994
1.47 mln
+1.23 mln
512.5%
jan 1, 1995
40.0K
-1.43 mln
-97.28%
jan 1, 1997
30.0K
-10.0K
-25.0%
jan 1, 1998
150.0K
+120.0K
400.0%
jan 1, 2000
830.0K
+680.0K
453.33%
jan 1, 2003
480.0K
-350.0K
-42.17%
jan 1, 2009
20.0K
-460.0K
-95.83%
Ranking of countries by current statistics by years