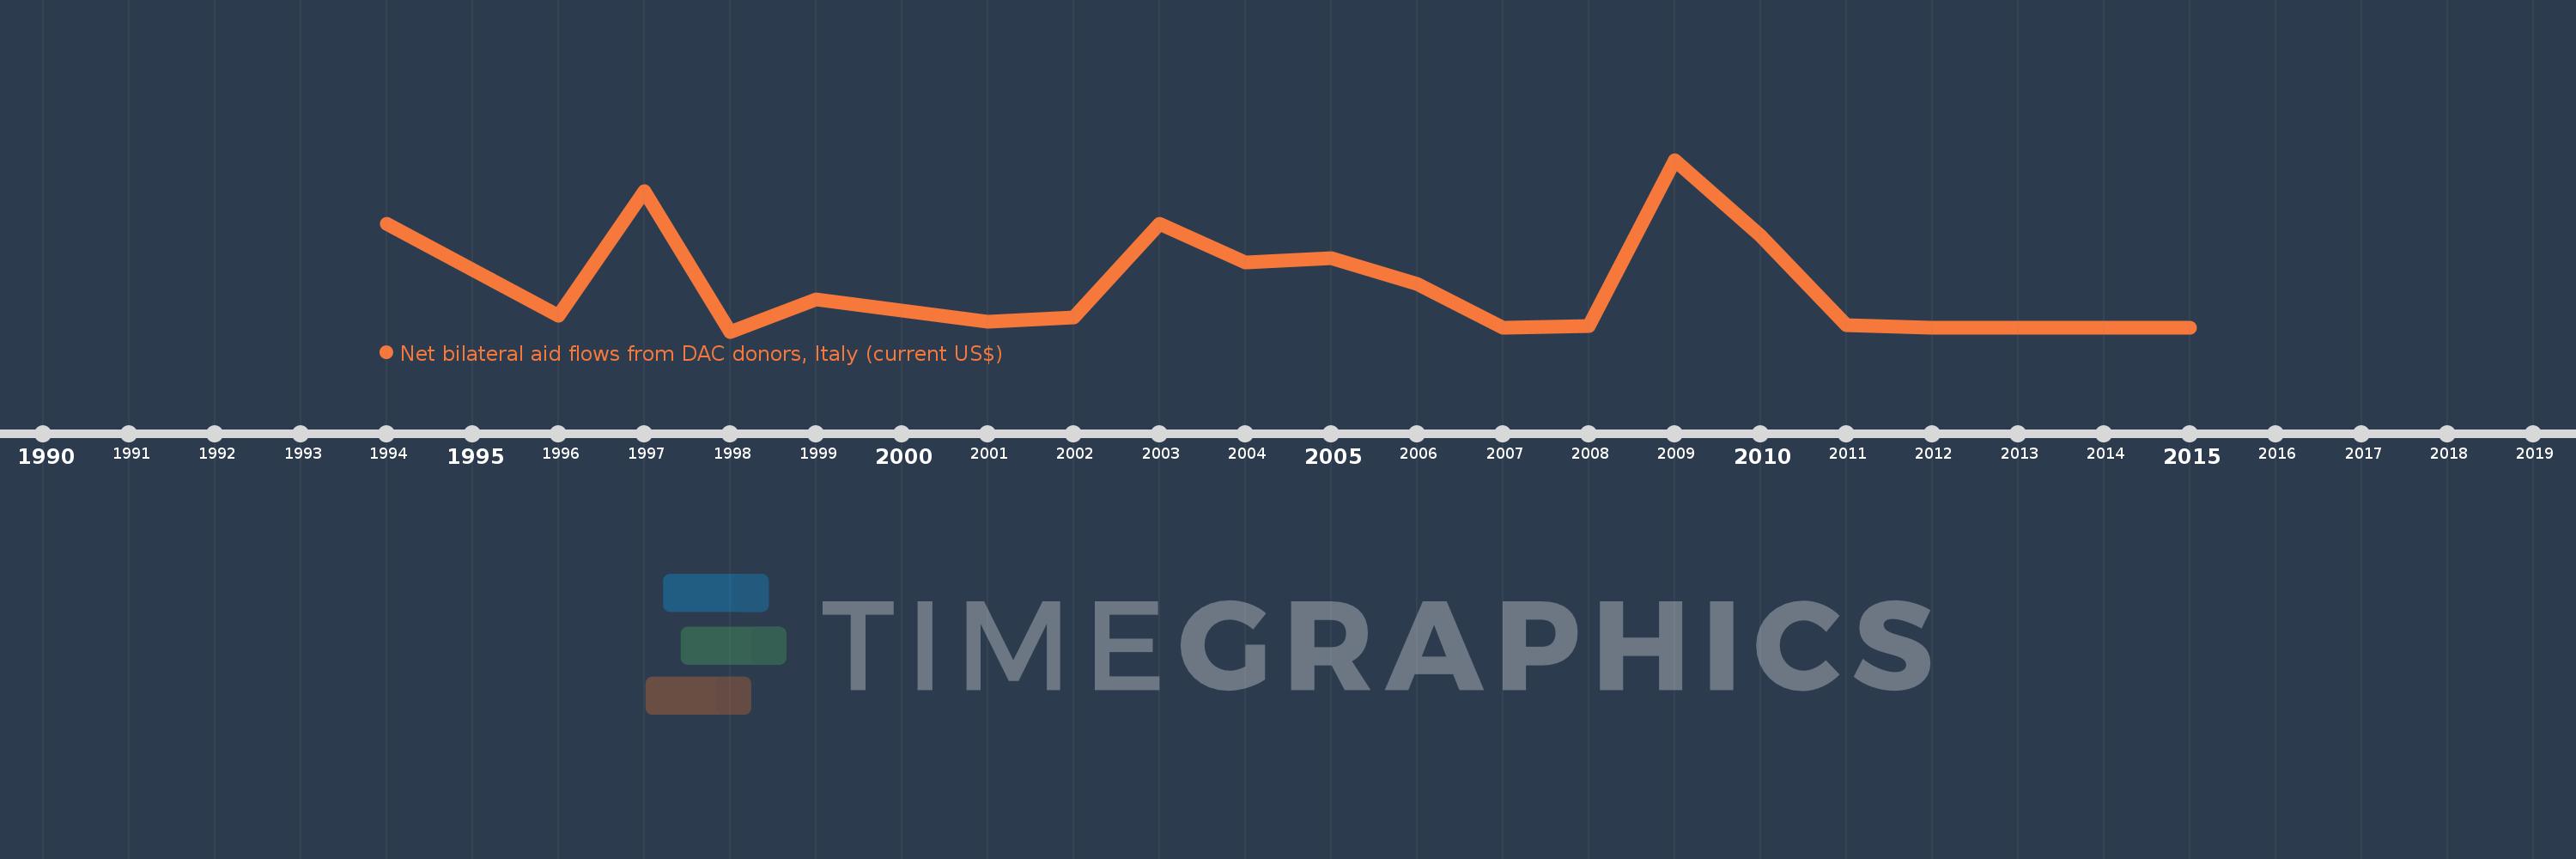
This timeline shows a graph from 1994 to 2015 of Georgia. No data until 1993. Number of actual observations by date: 21.
Source name:
World Development Indicators
Source organization:
Development Assistance Committee of the Organisation for Economic Co-operation and Development, Geographical Distribution of Financial Flows to Developing Countries, Development Co-operation Report, and International Development Statistics database. Data are available online at: www.oecd.org/dac/stats/idsonline.
Categories, topics:
Aid Effectiveness
Last updated:
apr 23, 2017
Indicators value changes by year
Meaning:
1.177 mln
Minimum:
20.0K
jan 1, 1998
Maximum:
4.48 mln
jan 1, 2009
At the date of observation
Value
Absolute change
Change from the previous value
jan 1, 1994
2.81 mln
+2.81 mln
0.0%
jan 1, 1996
440.0K
-2.37 mln
-84.34%
jan 1, 1997
3.67 mln
+3.23 mln
734.09%
jan 1, 1998
20.0K
-3.65 mln
-99.46%
jan 1, 1999
860.0K
+840.0K
4.2K%
jan 1, 2000
560.0K
-300.0K
-34.88%
jan 1, 2001
270.0K
-290.0K
-51.79%
jan 1, 2002
390.0K
+120.0K
44.44%
jan 1, 2003
2.81 mln
+2.42 mln
620.51%
jan 1, 2004
1.81 mln
-1000.0K
-35.59%
jan 1, 2005
1.92 mln
+110.0K
6.08%
jan 1, 2006
1.26 mln
-660.0K
-34.38%
jan 1, 2007
110.0K
-1.15 mln
-91.27%
jan 1, 2008
160.0K
+50.0K
45.45%
jan 1, 2009
4.48 mln
+4.32 mln
2.7K%
jan 1, 2010
2.51 mln
-1.97 mln
-43.97%
jan 1, 2011
180.0K
-2.33 mln
-92.83%
jan 1, 2012
110.0K
-70.0K
-38.89%
jan 1, 2013
120.0K
+10.0K
9.09%
jan 1, 2014
110.0K
-10.0K
-8.33%
jan 1, 2015
110.0K
0.0
0.0%
Ranking of countries by current statistics by years