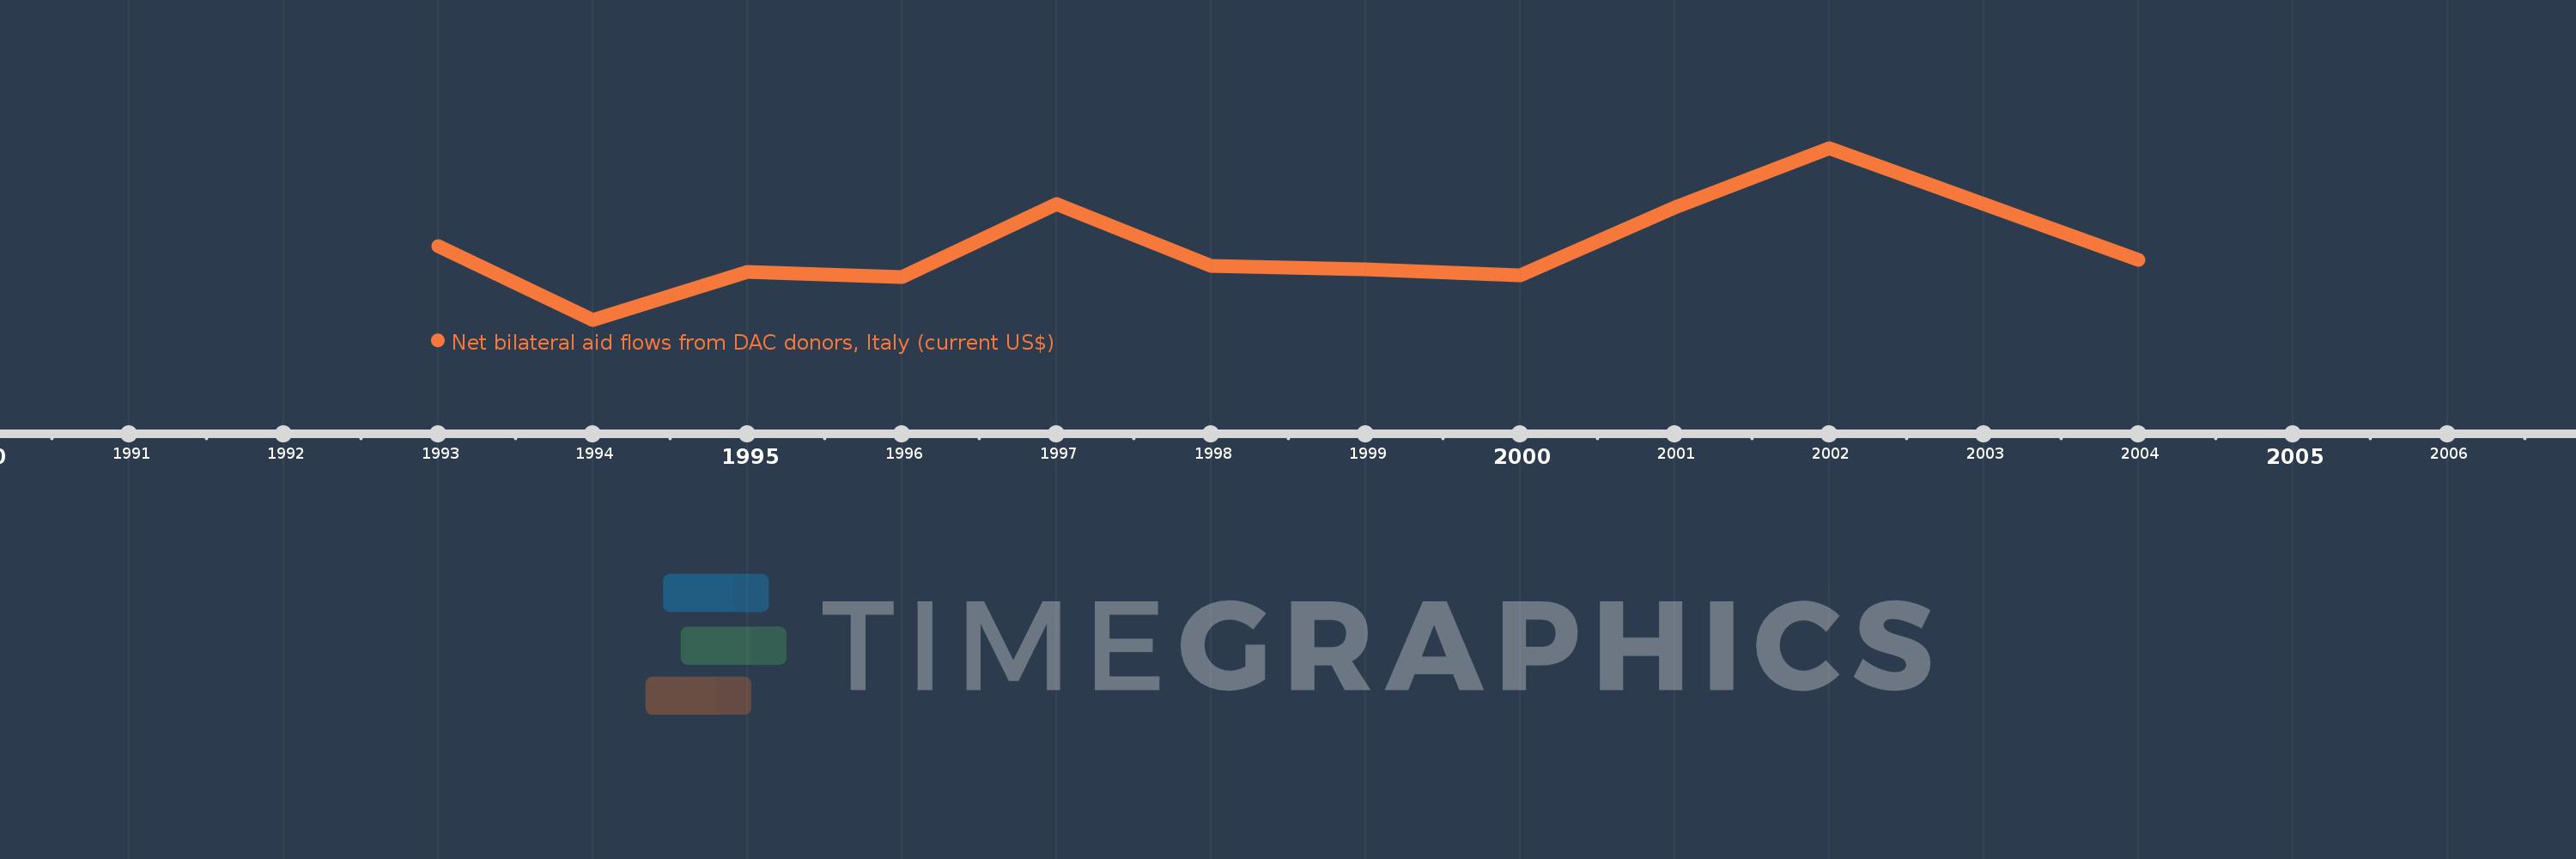
This timeline shows a graph from 1993 to 2004 of Slovak Republic. No data until 1992. Number of actual observations by date: 11.
Source name:
World Development Indicators
Source organization:
Development Assistance Committee of the Organisation for Economic Co-operation and Development, Geographical Distribution of Financial Flows to Developing Countries, Development Co-operation Report, and International Development Statistics database. Data are available online at: www.oecd.org/dac/stats/idsonline.
Categories, topics:
Aid Effectiveness
Last updated:
apr 23, 2017
Indicators value changes by year
Meaning:
393.636K
Minimum:
30.0K
jan 1, 1994
Maximum:
920.0K
jan 1, 2002
At the date of observation
Value
Absolute change
Change from the previous value
jan 1, 1993
410.0K
+410.0K
0.0%
jan 1, 1994
30.0K
-380.0K
-92.68%
jan 1, 1995
280.0K
+250.0K
833.33%
jan 1, 1996
250.0K
-30.0K
-10.71%
jan 1, 1997
630.0K
+380.0K
152.0%
jan 1, 1998
310.0K
-320.0K
-50.79%
jan 1, 1999
290.0K
-20.0K
-6.45%
jan 1, 2000
260.0K
-30.0K
-10.34%
jan 1, 2001
610.0K
+350.0K
134.62%
jan 1, 2002
920.0K
+310.0K
50.82%
jan 1, 2004
340.0K
-580.0K
-63.04%
Ranking of countries by current statistics by years