33
/
AIzaSyB4mHJ5NPEv-XzF7P6NDYXjlkCWaeKw5bc
November 30, 2025
179174
Liberia
LBR
true
2
1
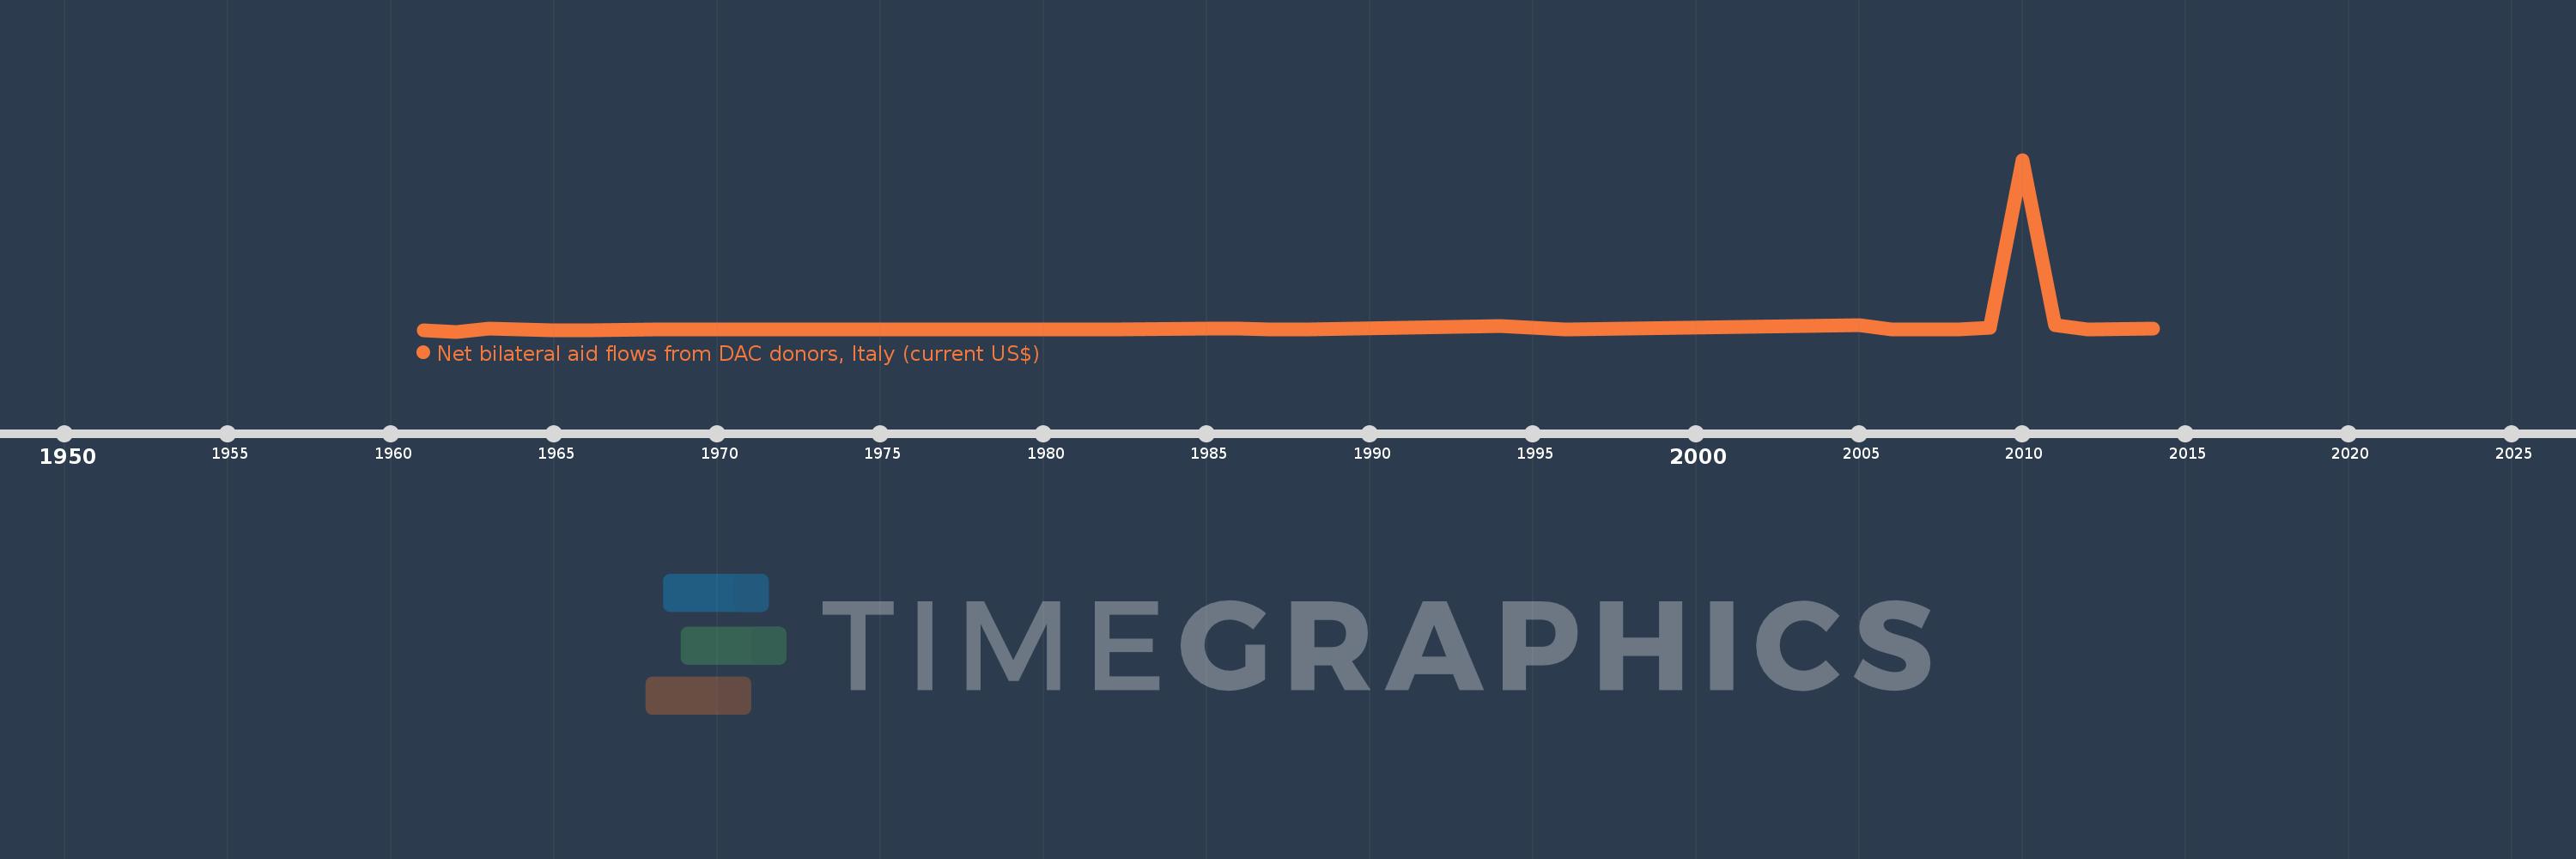
Net bilateral aid flows from DAC donors, Italy (current US$)
2014,2012,2011,2010,2009,2008,2006,2005,1996,1994,1988,1987,1986,1985,1982,1981,1980,1979,1978,1977,1976,1975,1974,1972,1971,1970,1969,1968,1966,1965,1964,1963,1962,1961