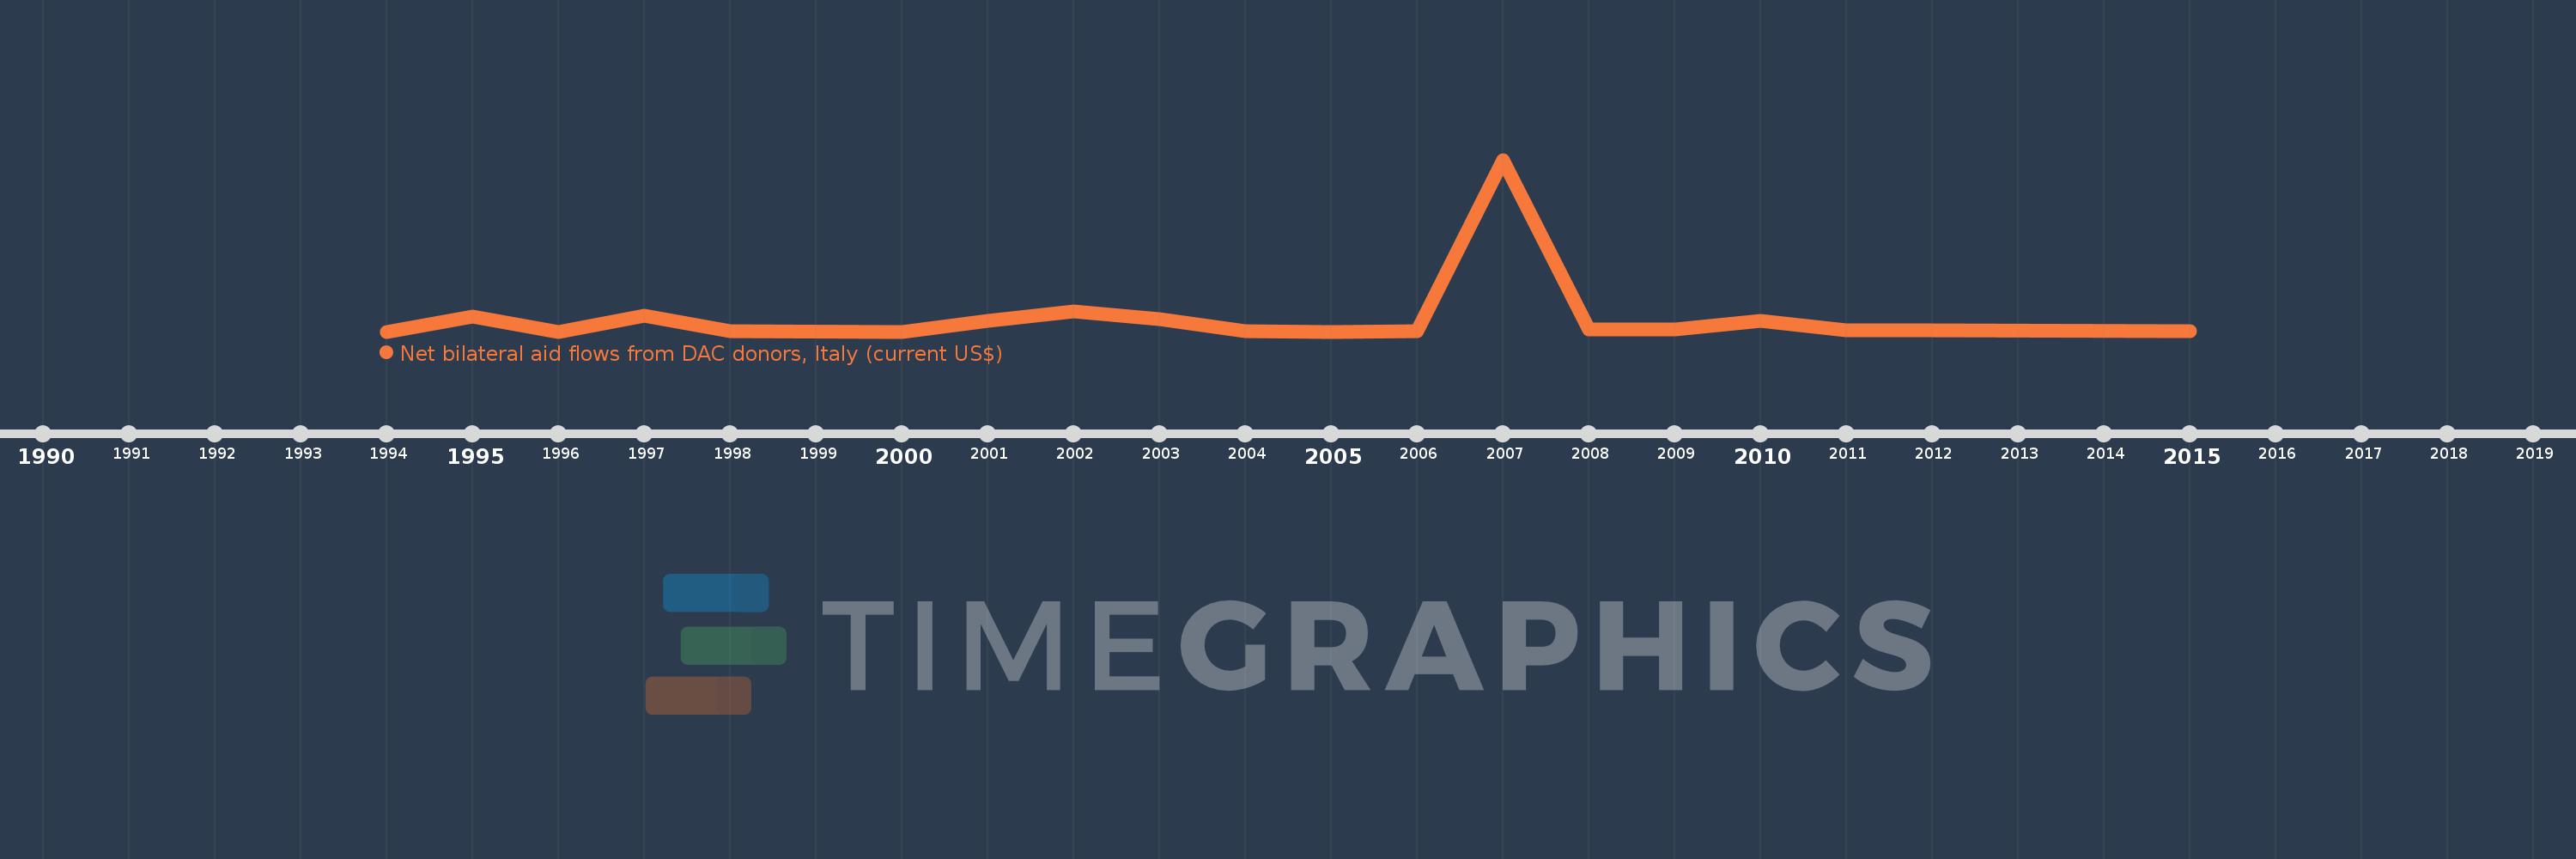
This timeline shows a graph from 1994 to 2015 of Mongolia. No data until 1993. Number of actual observations by date: 19.
Source name:
World Development Indicators
Source organization:
Development Assistance Committee of the Organisation for Economic Co-operation and Development, Geographical Distribution of Financial Flows to Developing Countries, Development Co-operation Report, and International Development Statistics database. Data are available online at: www.oecd.org/dac/stats/idsonline.
Categories, topics:
Aid Effectiveness
Last updated:
apr 23, 2017
Indicators value changes by year
Meaning:
1.143 mln
Minimum:
10.0K
jan 1, 1994
Maximum:
14.0 mln
jan 1, 2007
At the date of observation
Value
Absolute change
Change from the previous value
jan 1, 1994
10.0K
+10.0K
0.0%
jan 1, 1995
1.25 mln
+1.24 mln
12.4K%
jan 1, 1996
10.0K
-1.24 mln
-99.2%
jan 1, 1997
1.29 mln
+1.28 mln
12.8K%
jan 1, 1998
20.0K
-1.27 mln
-98.45%
jan 1, 2000
10.0K
-10.0K
-50.0%
jan 1, 2001
890.0K
+880.0K
8.8K%
jan 1, 2002
1.64 mln
+750.0K
84.27%
jan 1, 2003
1.01 mln
-630.0K
-38.41%
jan 1, 2004
20.0K
-990.0K
-98.02%
jan 1, 2005
10.0K
-10.0K
-50.0%
jan 1, 2006
60.0K
+50.0K
500.0%
jan 1, 2007
14.0 mln
+13.94 mln
23.23K%
jan 1, 2008
210.0K
-13.79 mln
-98.5%
jan 1, 2009
180.0K
-30.0K
-14.29%
jan 1, 2010
860.0K
+680.0K
377.78%
jan 1, 2011
90.0K
-770.0K
-89.53%
jan 1, 2012
120.0K
+30.0K
33.33%
jan 1, 2015
30.0K
-90.0K
-75.0%
Ranking of countries by current statistics by years