33
/it/
AIzaSyAYiBZKx7MnpbEhh9jyipgxe19OcubqV5w
August 1, 2025
97104
Cabo Verde
CPV
true
2
1
Claims on other sectors of the domestic economy (% of GDP)
2016,2015,2014,2013,2012,2011,2010,2009,2008,2007,2006,2005,2004,2003,2002
Download
Biblioteca di statistiche globali →Cabo Verde →

Claims on other sectors of the domestic economy (% of GDP)

Queste statistiche in altri paesi:

AfghanistanAlbaniaAlgeriaAngolaAntigua and BarbudaArmeniaAustraliaAustriaAzerbaijanBangladeshBarbadosBelarusBelgiumBelizeBeninBhutanBoliviaBosnia and HerzegovinaBotswanaBrazilBrunei DarussalamBulgariaBurkina FasoBurundiCabo VerdeCambodiaCameroonCanadaCaribbean small statesCentral African RepublicCentral Europe and the BalticsChadChileColombiaComorosCongo, Dem. Rep.Congo, Rep.Costa RicaCote d'IvoireCroatiaCyprusCzech RepublicDenmarkDominicaDominican RepublicEast Asia & PacificEcuadorEgypt, Arab Rep.El SalvadorEquatorial GuineaEritreaEstoniaEuro areaEurope & Central AsiaEurope & Central Asia (excluding high income)Europe & Central Asia (IDA & IBRD countries)European UnionFijiFinlandFragile and conflict affected situationsFranceGabonGambia, TheGeorgiaGermanyGhanaGreeceGrenadaGuatemalaGuinea-BissauGuyanaHaitiHeavily indebted poor countries (HIPC)High incomeHondurasHungaryIcelandIDA blendIDA onlyIDA totalIndonesiaIraqIrelandIsraelItalyJamaicaJapanKazakhstanKenyaKorea, Rep.KosovoKuwaitKyrgyz RepublicLatin America & Caribbean Latin America & Caribbean (excluding high income)Latin America & the Caribbean (IDA & IBRD countries)LatviaLeast developed countries: UN classificationLesothoLithuaniaLow incomeLuxembourgMacao SAR, ChinaMacedonia, FYRMalaysiaMaldivesMaliMaltaMauritiusMexicoMiddle East & North AfricaMiddle East & North Africa (excluding high income)Middle East & North Africa (IDA & IBRD countries)MoldovaMongoliaMoroccoMozambiqueMyanmarNamibiaNepalNetherlandsNicaraguaNigerNigeriaNorth AmericaNorwayOECD membersOmanOther small statesPacific island small statesPakistanPanamaPapua New GuineaParaguayPhilippinesPolandPortugalPost-demographic dividendPre-demographic dividendQatarRomaniaRussian FederationRwandaSamoaSao Tome and PrincipeSenegalSerbiaSeychellesSierra LeoneSlovak RepublicSloveniaSmall statesSolomon IslandsSouth AfricaSouth SudanSpainSri LankaSt. Kitts and NevisSt. LuciaSt. Vincent and the GrenadinesSub-Saharan Africa Sub-Saharan Africa (excluding high income)Sub-Saharan Africa (IDA & IBRD countries)SudanSurinameSwazilandSwedenSyrian Arab RepublicTajikistanTanzaniaThailandTimor-LesteTogoTongaTrinidad and TobagoTurkeyUgandaUkraineUnited Arab EmiratesUnited StatesUruguayVanuatuVenezuela, RBWest Bank and GazaWorldZambia

Linea del tempo:

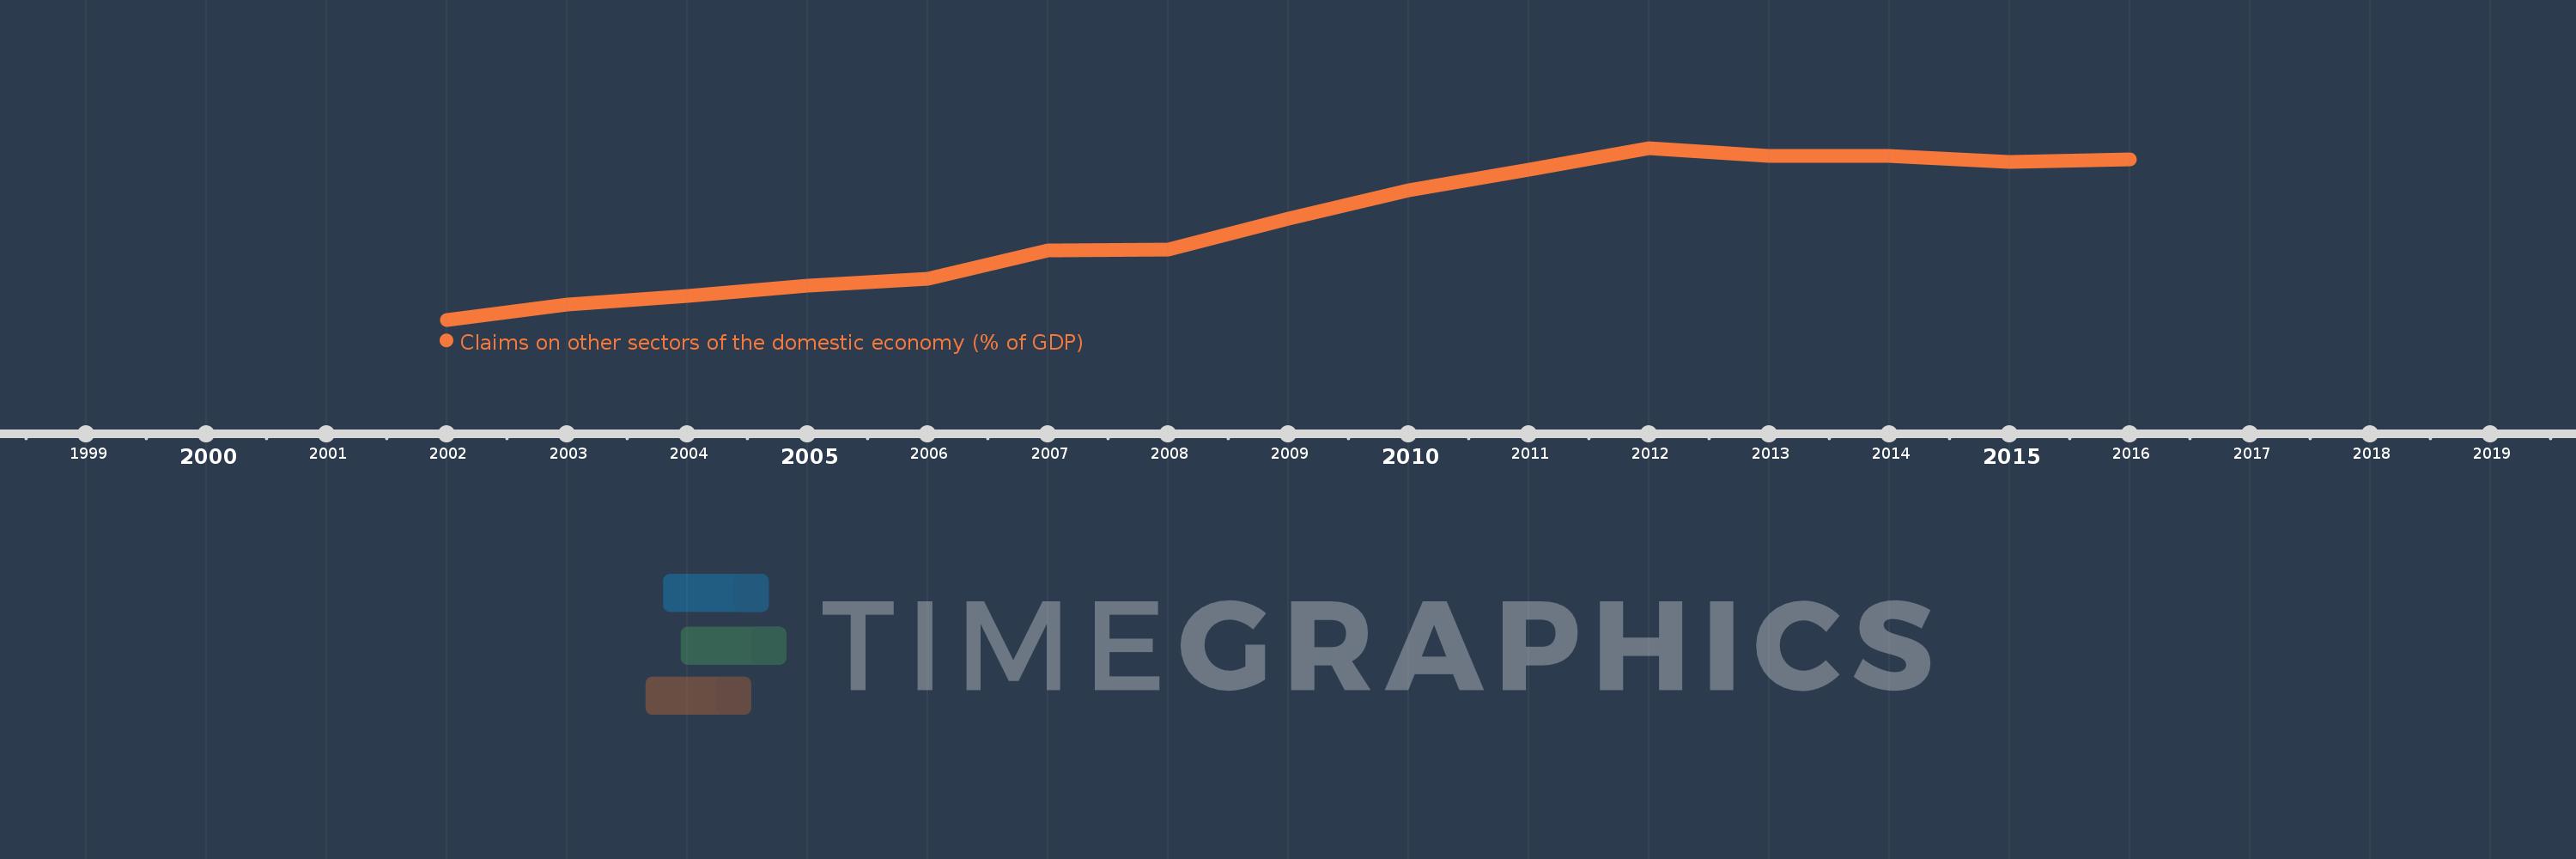
Questa scala temporale mostra un grafico dal 2002 anno al 2016 anno. Cabo Verde. I dati fino ad 2001 anno non disponibili. Il numero di osservazioni attuali secondo i date: 15.

La fonte (nome):

Indicatori dello sviluppo mondiale

La fonte (organizzazione):

International Monetary Fund, International Financial Statistics and data files, and World Bank and OECD GDP estimates.

Categorie:

Financial Sector

sono stati aggiornati

23 apr 2017 anni

Indicatori delle variazioni dei valori per anni

In media:
52.43
Minima:
31.943
1 gen 2002 anni
Massimo:
68.318
1 gen 2012 anni
Alla data di osservazione
Valore
Variazione assoluta
La variazione rispetto al valore precedente
1 gen 2002 anni
31.943
+31.943
0.0%
1 gen 2003 anni
35.118
+3.175
9.94%
1 gen 2004 anni
37.027
+1.909
5.43%
1 gen 2005 anni
39.088
+2.061
5.57%
1 gen 2006 anni
40.637
+1.549
3.96%
1 gen 2007 anni
46.658
+6.022
14.82%
1 gen 2008 anni
46.893
+0.235
0.5%
1 gen 2009 anni
53.342
+6.449
13.75%
1 gen 2010 anni
59.349
+6.007
11.26%
1 gen 2011 anni
63.718
+4.369
7.36%
1 gen 2012 anni
68.318
+4.6
7.22%
1 gen 2013 anni
66.571
-1.747
-2.56%
1 gen 2014 anni
66.582
+0.011
0.02%
1 gen 2015 anni
65.293
-1.29
-1.94%
1 gen 2016 anni
65.917
+0.624
0.96%

Classificazione dei paesi secondo i statistiche attuali per anni