29
/it/
it
AIzaSyAYiBZKx7MnpbEhh9jyipgxe19OcubqV5w
April 1, 2024
59587
Sub-Saharan Africa (excluding high income)
SSA
false
2
1
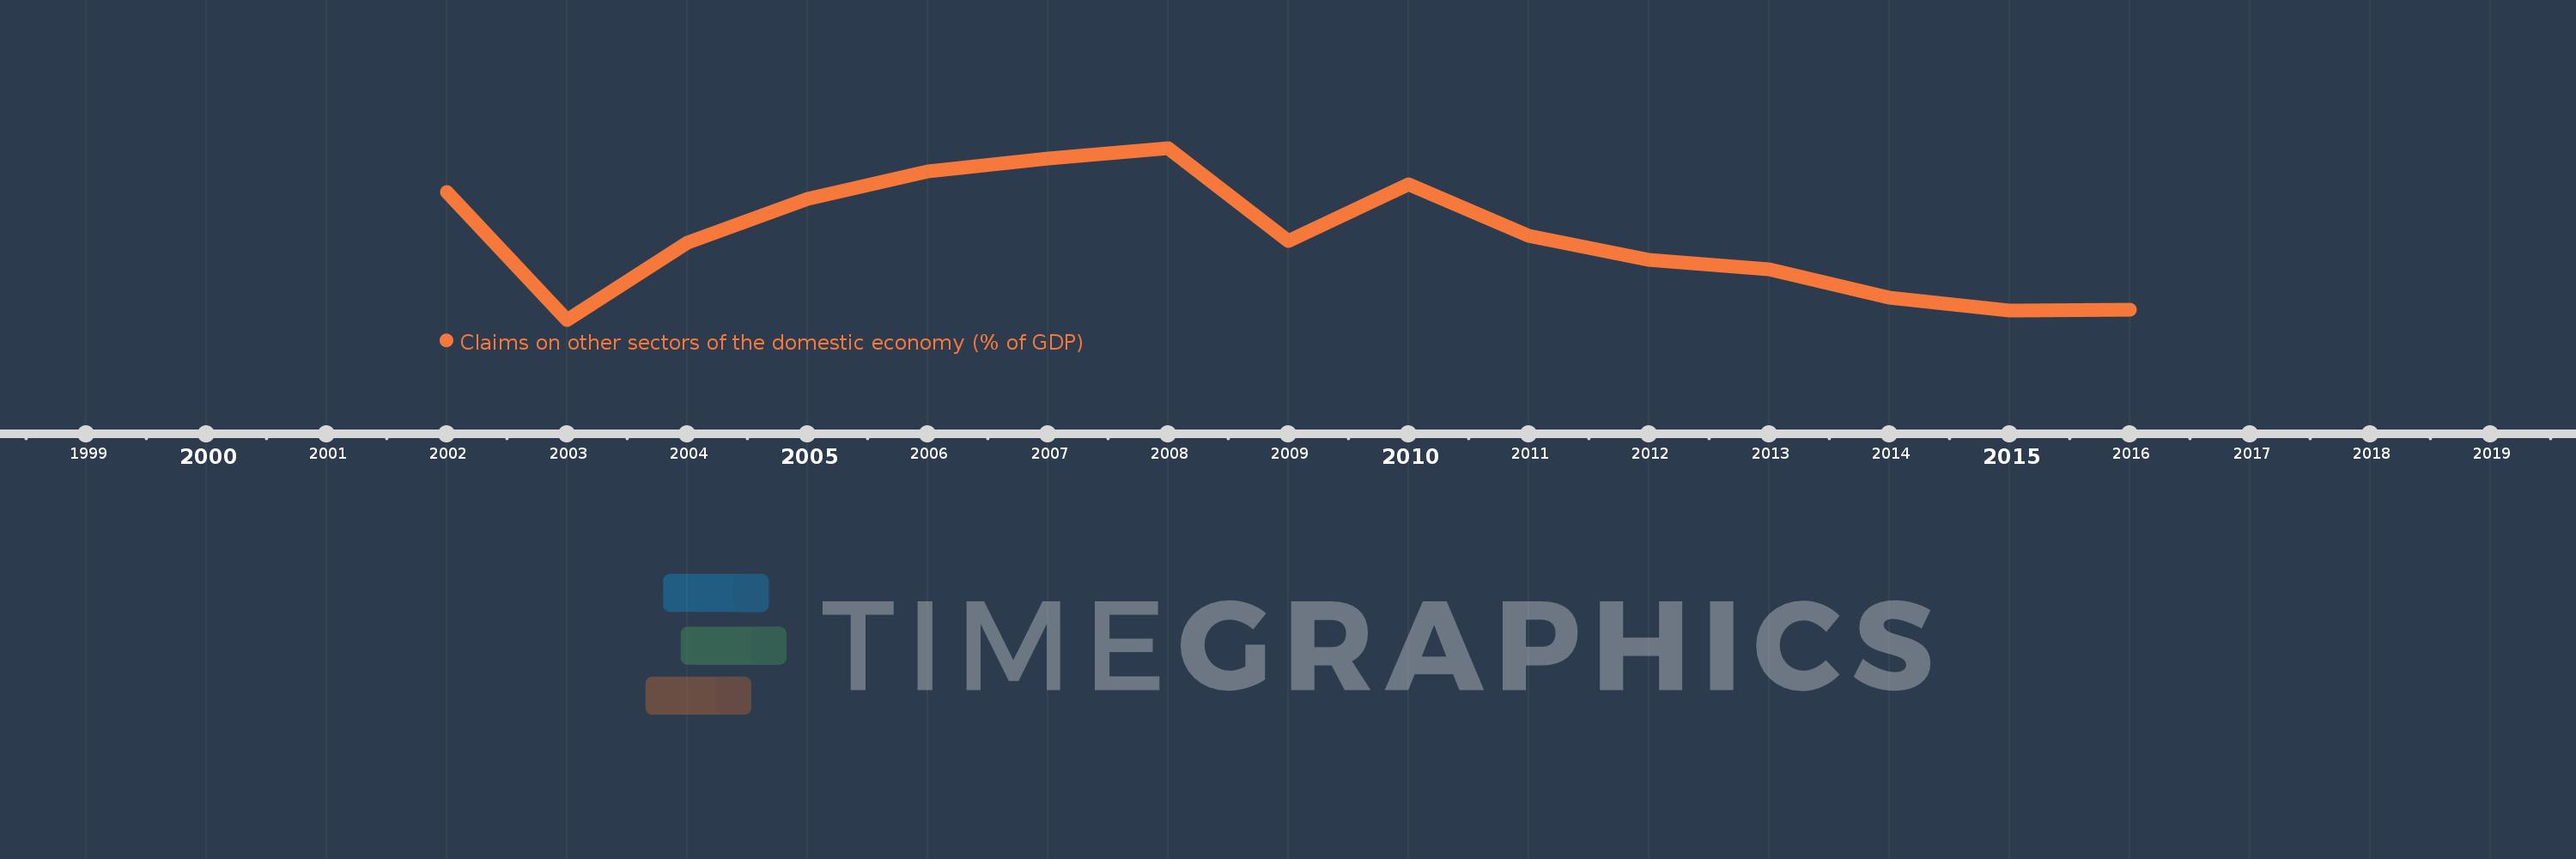
Claims on other sectors of the domestic economy (% of GDP)
2016,2015,2014,2013,2012,2011,2010,2009,2008,2007,2006,2005,2004,2003,2002
Queste statistiche in altri paesi:
Linea del tempo:
Questa scala temporale mostra un grafico dal 2002 anno al 2016 anno. Sub-Saharan Africa (excluding high income). I dati fino ad 2001 anno non disponibili. Il numero di osservazioni attuali secondo i date: 15.
La fonte (nome):
Indicatori dello sviluppo mondiale
La fonte (organizzazione):
International Monetary Fund, International Financial Statistics and data files, and World Bank and OECD GDP estimates.
Categorie:
Financial Sector
sono stati aggiornati
23 apr 2017 anni
Indicatori delle variazioni dei valori per anni
Minima:
50.599
1 gen 2003 anni
Massimo:
73.175
1 gen 2008 anni
Alla data di osservazione
Valore
Variazione assoluta
La variazione rispetto al valore precedente
1 gen 2002 anni
67.345
+67.345
0.0%
1 gen 2003 anni
50.599
-16.745
-24.87%
1 gen 2004 anni
60.748
+10.149
20.06%
1 gen 2005 anni
66.435
+5.688
9.36%
1 gen 2006 anni
70.109
+3.673
5.53%
1 gen 2007 anni
71.791
+1.682
2.4%
1 gen 2008 anni
73.175
+1.385
1.93%
1 gen 2009 anni
60.905
-12.27
-16.77%
1 gen 2010 anni
68.394
+7.489
12.3%
1 gen 2011 anni
61.628
-6.766
-9.89%
1 gen 2012 anni
58.442
-3.186
-5.17%
1 gen 2013 anni
57.247
-1.195
-2.05%
1 gen 2014 anni
53.526
-3.721
-6.5%
1 gen 2015 anni
51.763
-1.762
-3.29%
1 gen 2016 anni
51.937
+0.174
0.34%
Classificazione dei paesi secondo i statistiche attuali per anni
Commenti: