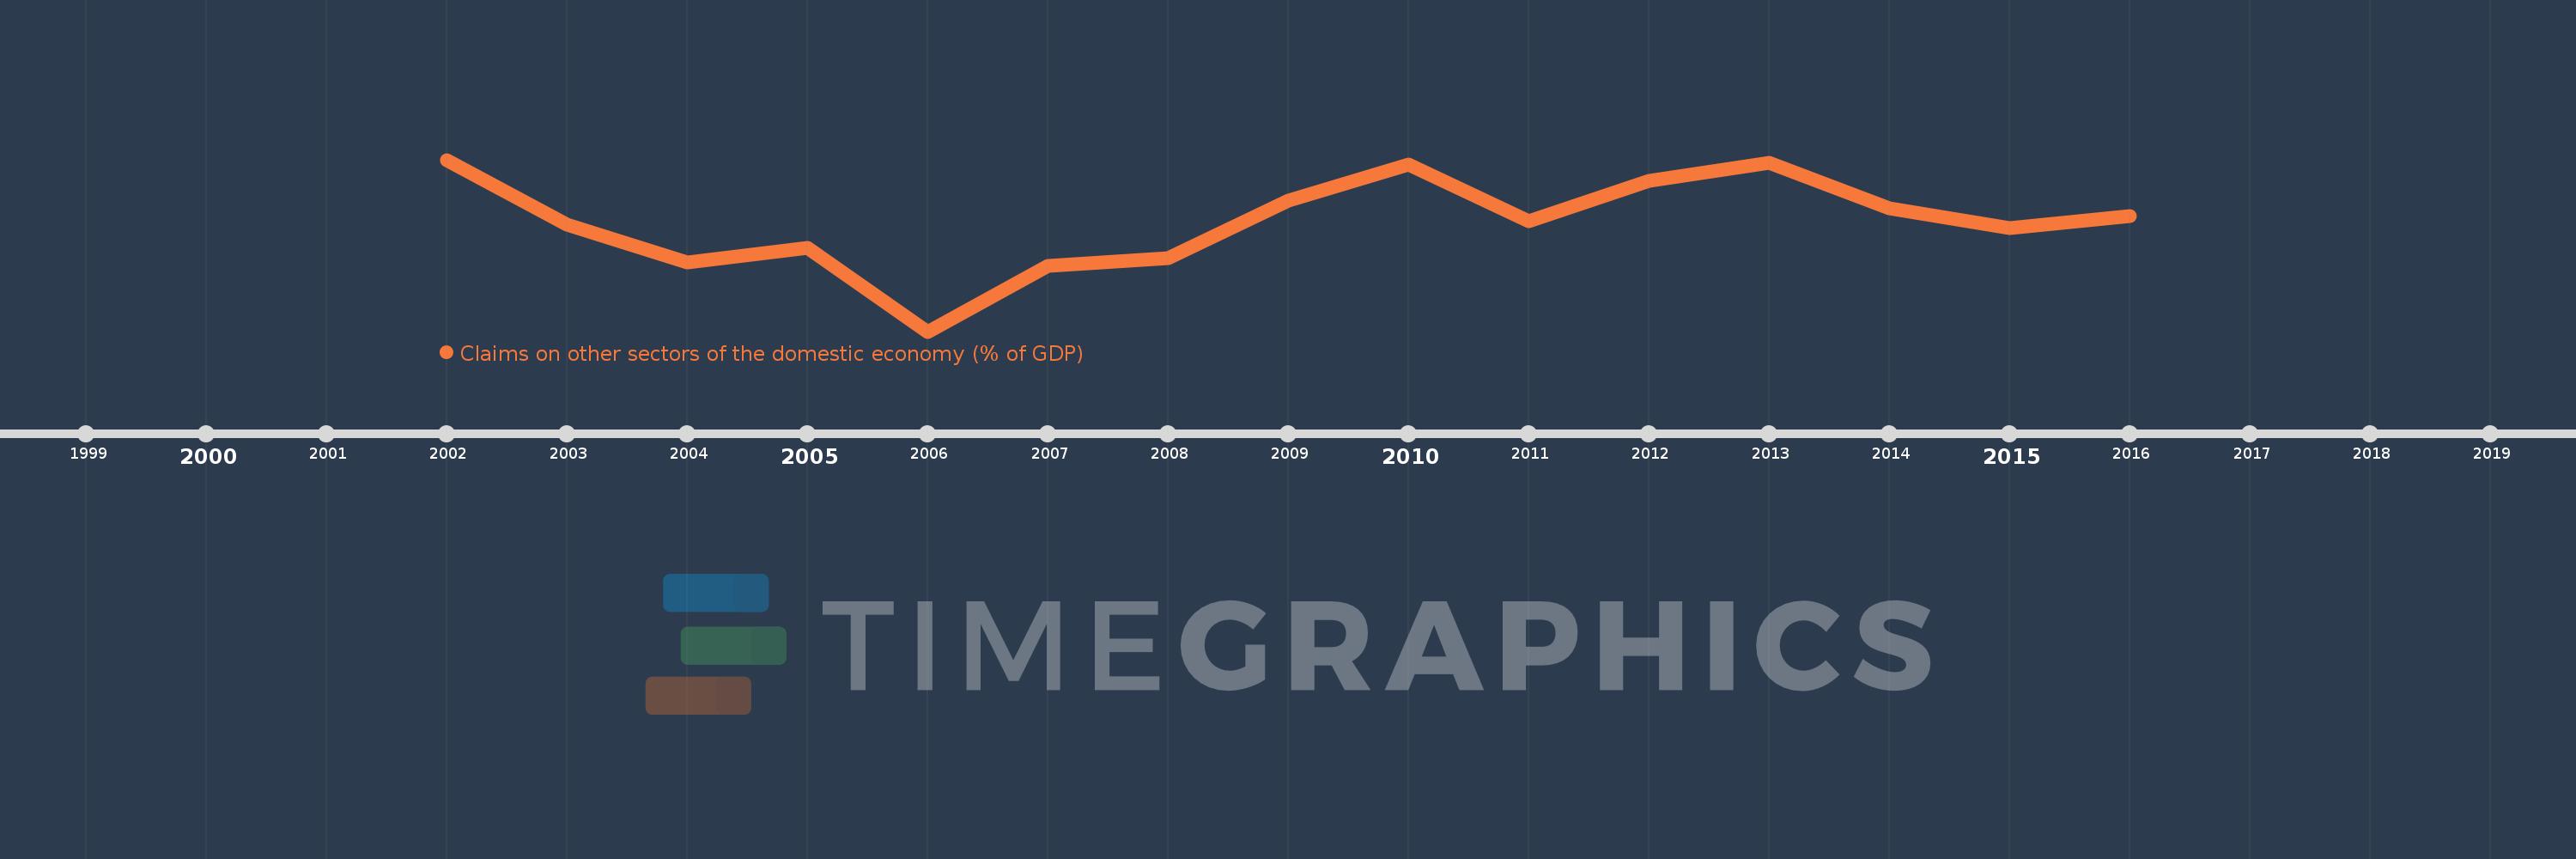
Questa scala temporale mostra un grafico dal 2002 anno al 2016 anno. St. Vincent and the Grenadines. I dati fino ad 2001 anno non disponibili. Il numero di osservazioni attuali secondo i date: 15.
La fonte (nome):
Indicatori dello sviluppo mondiale
La fonte (organizzazione):
International Monetary Fund, International Financial Statistics and data files, and World Bank and OECD GDP estimates.
Categorie:
Financial Sector
sono stati aggiornati
23 apr 2017 anni
Indicatori delle variazioni dei valori per anni
In media:
53.653
Minima:
49.719
1 gen 2006 anni
Massimo:
55.896
1 gen 2002 anni
Alla data di osservazione
Valore
Variazione assoluta
La variazione rispetto al valore precedente
1 gen 2002 anni
55.896
+55.896
0.0%
1 gen 2003 anni
53.561
-2.335
-4.18%
1 gen 2004 anni
52.191
-1.37
-2.56%
1 gen 2005 anni
52.718
+0.527
1.01%
1 gen 2006 anni
49.719
-2.999
-5.69%
1 gen 2007 anni
52.092
+2.374
4.77%
1 gen 2008 anni
52.372
+0.28
0.54%
1 gen 2009 anni
54.418
+2.046
3.91%
1 gen 2010 anni
55.739
+1.321
2.43%
1 gen 2011 anni
53.694
-2.045
-3.67%
1 gen 2012 anni
55.14
+1.446
2.69%
1 gen 2013 anni
55.774
+0.634
1.15%
1 gen 2014 anni
54.146
-1.627
-2.92%
1 gen 2015 anni
53.439
-0.707
-1.31%
1 gen 2016 anni
53.888
+0.448
0.84%
Classificazione dei paesi secondo i statistiche attuali per anni