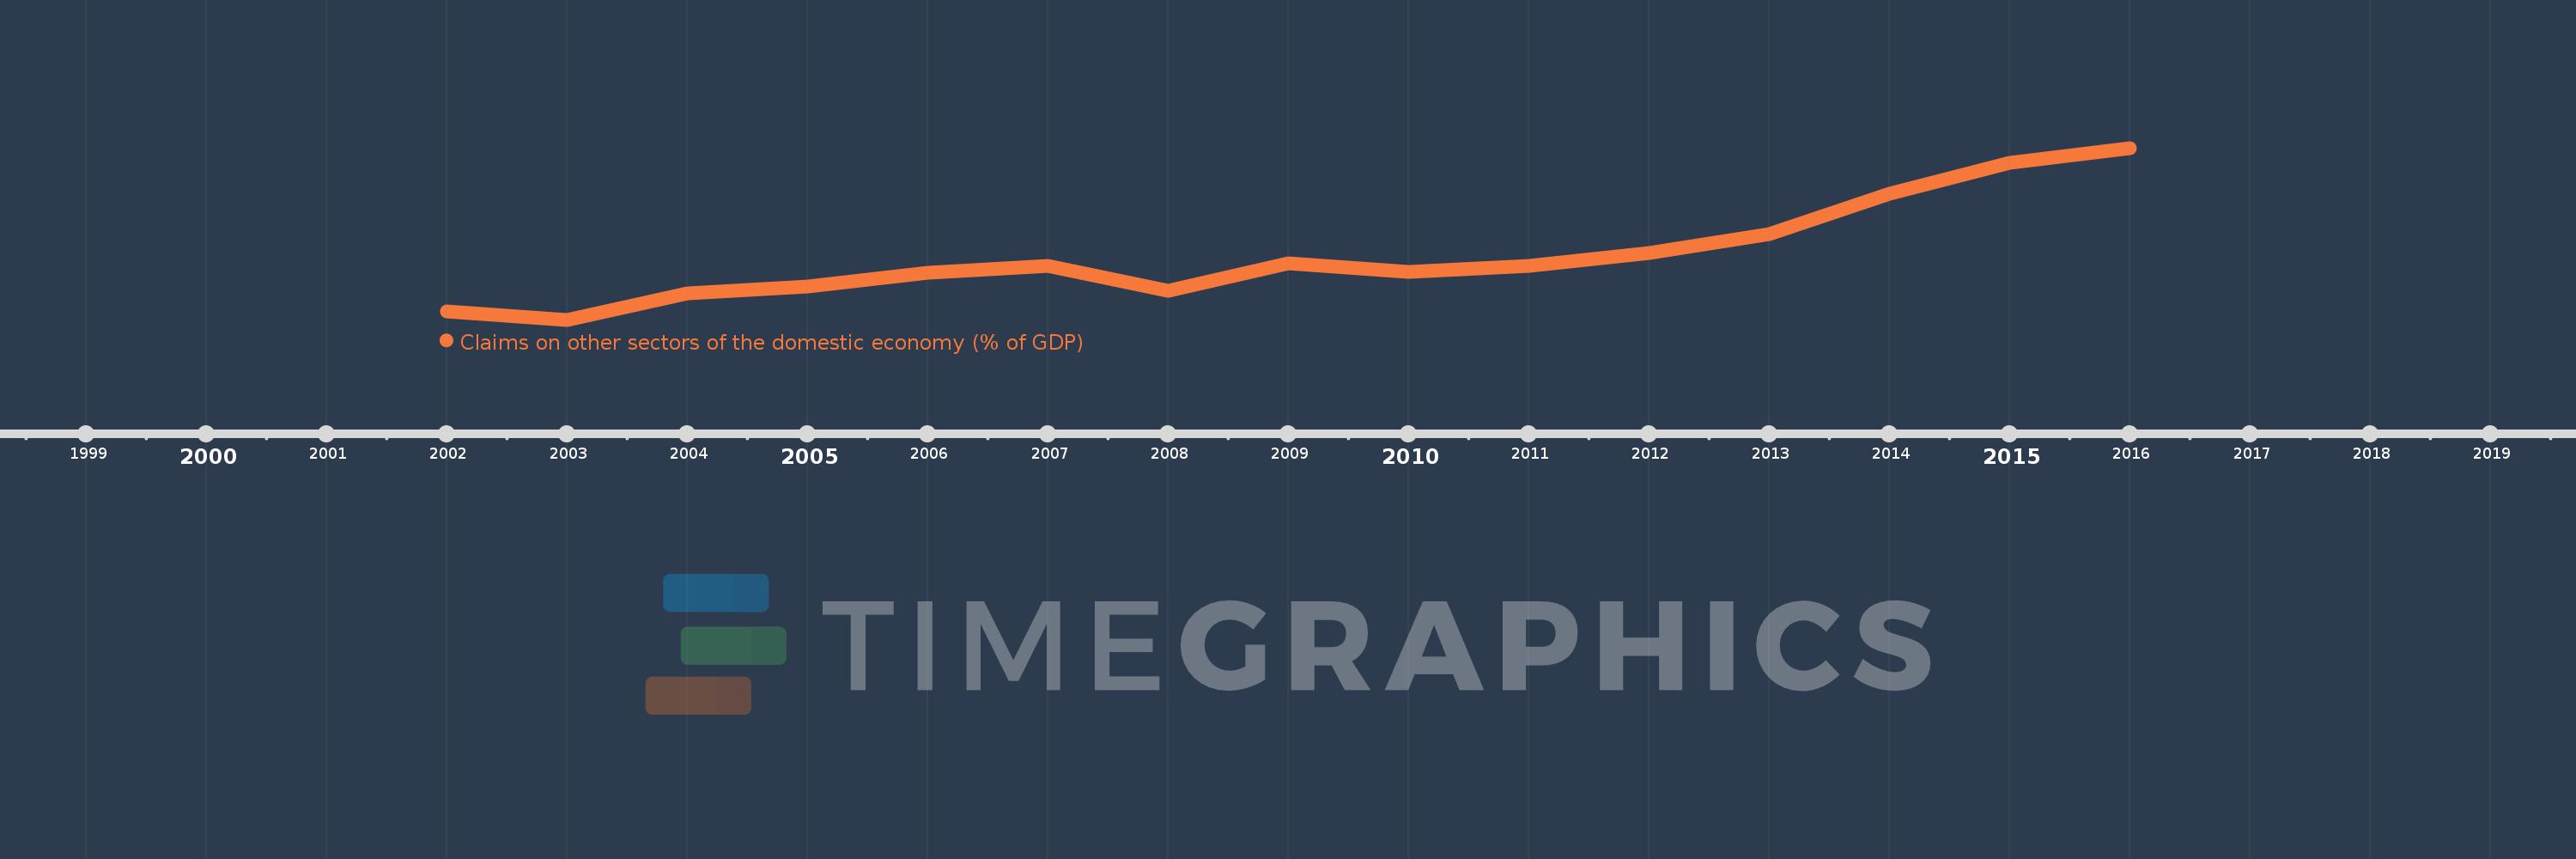
Questa scala temporale mostra un grafico dal 2002 anno al 2016 anno. Burkina Faso. I dati fino ad 2001 anno non disponibili. Il numero di osservazioni attuali secondo i date: 15.
La fonte (nome):
Indicatori dello sviluppo mondiale
La fonte (organizzazione):
International Monetary Fund, International Financial Statistics and data files, and World Bank and OECD GDP estimates.
Categorie:
Financial Sector
sono stati aggiornati
23 apr 2017 anni
Indicatori delle variazioni dei valori per anni
In media:
18.858
Minima:
11.49
1 gen 2003 anni
Massimo:
31.216
1 gen 2016 anni
Alla data di osservazione
Valore
Variazione assoluta
La variazione rispetto al valore precedente
1 gen 2002 anni
12.449
+12.449
0.0%
1 gen 2003 anni
11.49
-0.959
-7.71%
1 gen 2004 anni
14.475
+2.985
25.98%
1 gen 2005 anni
15.315
+0.84
5.8%
1 gen 2006 anni
16.843
+1.528
9.98%
1 gen 2007 anni
17.671
+0.828
4.92%
1 gen 2008 anni
14.825
-2.846
-16.1%
1 gen 2009 anni
17.98
+3.154
21.28%
1 gen 2010 anni
16.993
-0.986
-5.49%
1 gen 2011 anni
17.712
+0.718
4.23%
1 gen 2012 anni
19.179
+1.467
8.28%
1 gen 2013 anni
21.354
+2.175
11.34%
1 gen 2014 anni
25.91
+4.557
21.34%
1 gen 2015 anni
29.462
+3.551
13.71%
1 gen 2016 anni
31.216
+1.755
5.96%
Classificazione dei paesi secondo i statistiche attuali per anni