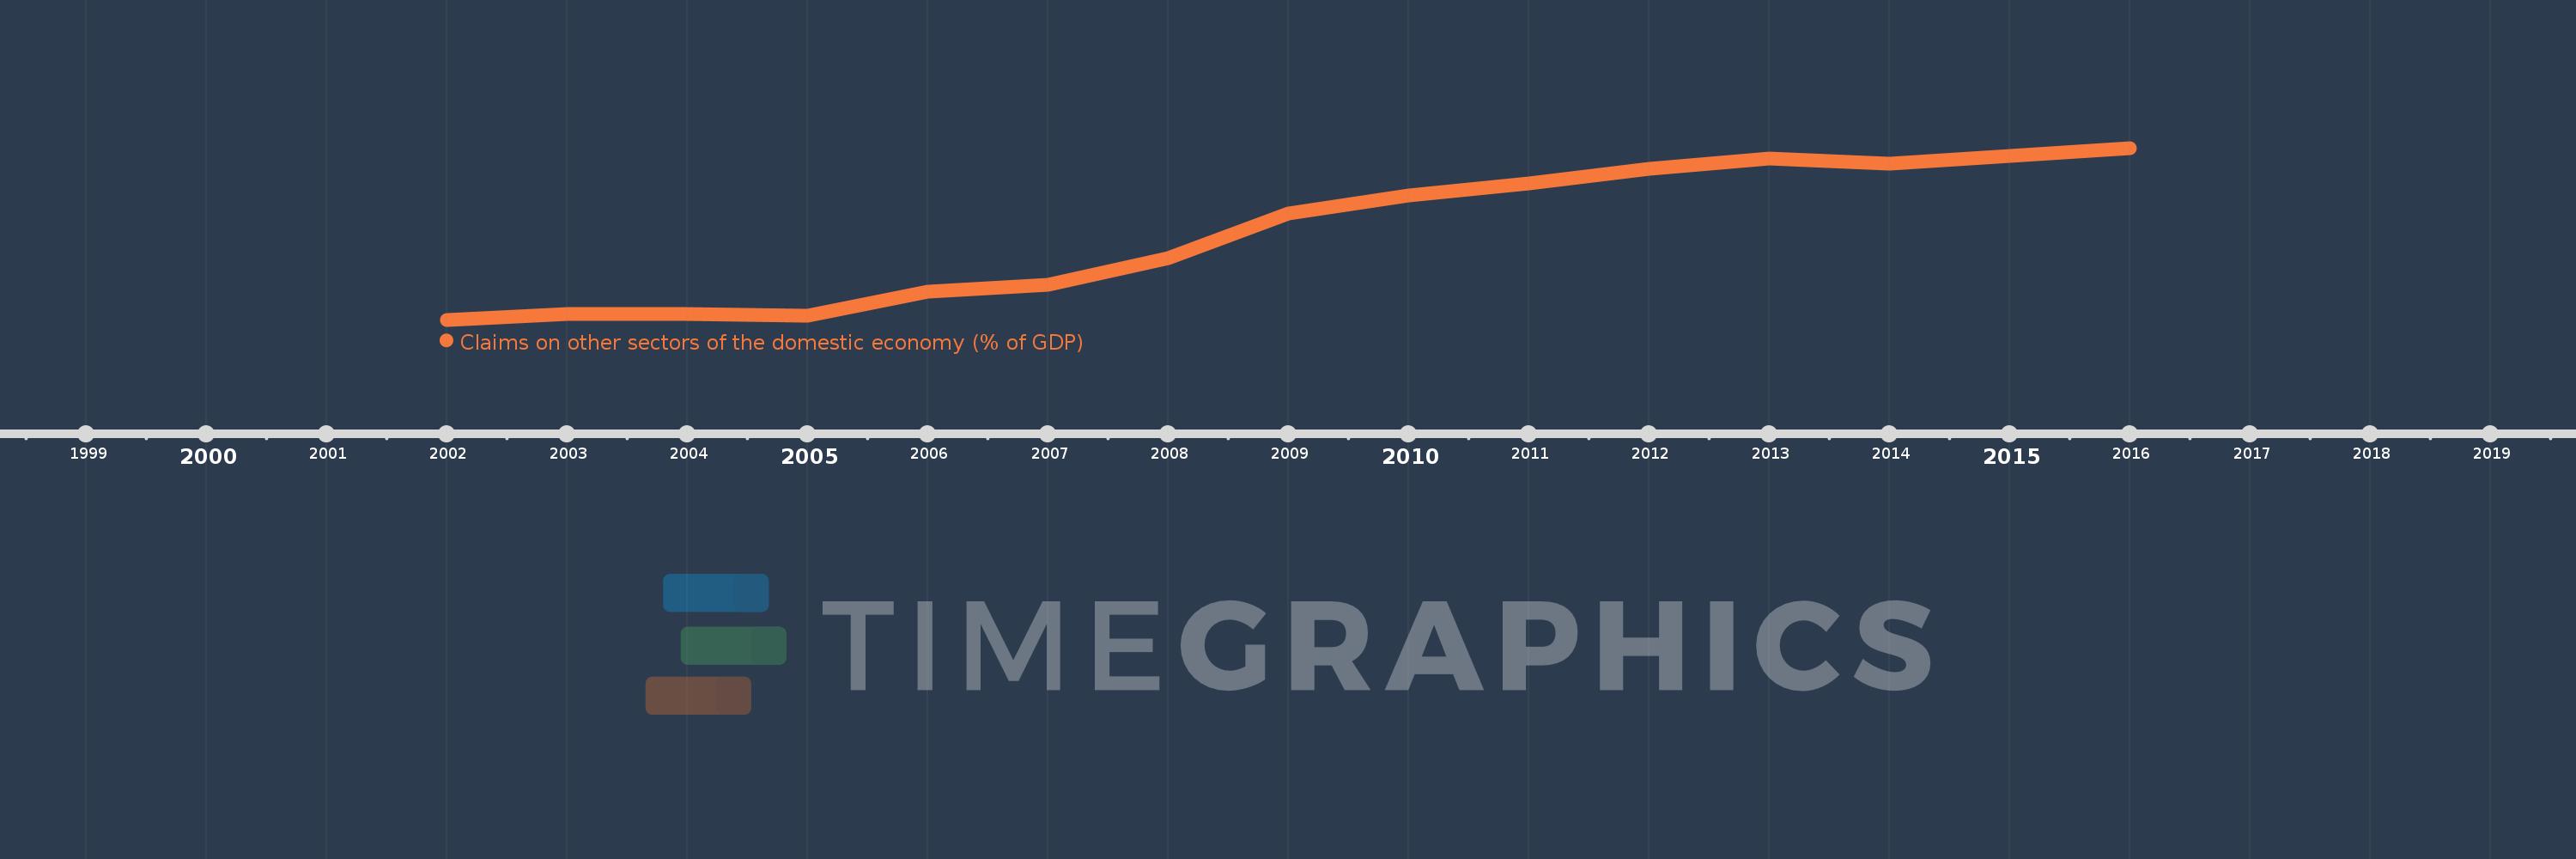
Questa scala temporale mostra un grafico dal 2002 anno al 2016 anno. Cyprus. I dati fino ad 2001 anno non disponibili. Il numero di osservazioni attuali secondo i date: 15.
La fonte (nome):
Indicatori dello sviluppo mondiale
La fonte (organizzazione):
International Monetary Fund, International Financial Statistics and data files, and World Bank and OECD GDP estimates.
Categorie:
Financial Sector
sono stati aggiornati
23 apr 2017 anni
Indicatori delle variazioni dei valori per anni
In media:
218.76
Minima:
144.889
1 gen 2002 anni
Massimo:
290.154
1 gen 2016 anni
Alla data di osservazione
Valore
Variazione assoluta
La variazione rispetto al valore precedente
1 gen 2002 anni
144.889
+144.889
0.0%
1 gen 2003 anni
149.528
+4.639
3.2%
1 gen 2004 anni
149.431
-0.097
-0.06%
1 gen 2005 anni
148.583
-0.848
-0.57%
1 gen 2006 anni
168.945
+20.362
13.7%
1 gen 2007 anni
174.32
+5.374
3.18%
1 gen 2008 anni
196.777
+22.457
12.88%
1 gen 2009 anni
234.784
+38.007
19.31%
1 gen 2010 anni
249.83
+15.046
6.41%
1 gen 2011 anni
259.986
+10.156
4.07%
1 gen 2012 anni
272.793
+12.807
4.93%
1 gen 2013 anni
281.081
+8.288
3.04%
1 gen 2014 anni
277.047
-4.033
-1.43%
1 gen 2015 anni
283.252
+6.205
2.24%
1 gen 2016 anni
290.154
+6.902
2.44%
Classificazione dei paesi secondo i statistiche attuali per anni