30
/it/
AIzaSyAYiBZKx7MnpbEhh9jyipgxe19OcubqV5w
April 1, 2024
279563
Vanuatu
VUT
true
2
1
Claims on other sectors of the domestic economy (% of GDP)
2016,2015,2014,2013,2012,2011,2010,2009,2008,2007,2006,2005,2004,2003,2002
Download
Biblioteca di statistiche globali →Vanuatu →

Claims on other sectors of the domestic economy (% of GDP)

Queste statistiche in altri paesi:

AfghanistanAlbaniaAlgeriaAngolaAntigua and BarbudaArmeniaAustraliaAustriaAzerbaijanBangladeshBarbadosBelarusBelgiumBelizeBeninBhutanBoliviaBosnia and HerzegovinaBotswanaBrazilBrunei DarussalamBulgariaBurkina FasoBurundiCabo VerdeCambodiaCameroonCanadaCaribbean small statesCentral African RepublicCentral Europe and the BalticsChadChileColombiaComorosCongo, Dem. Rep.Congo, Rep.Costa RicaCote d'IvoireCroatiaCyprusCzech RepublicDenmarkDominicaDominican RepublicEast Asia & PacificEcuadorEgypt, Arab Rep.El SalvadorEquatorial GuineaEritreaEstoniaEuro areaEurope & Central AsiaEurope & Central Asia (excluding high income)Europe & Central Asia (IDA & IBRD countries)European UnionFijiFinlandFragile and conflict affected situationsFranceGabonGambia, TheGeorgiaGermanyGhanaGreeceGrenadaGuatemalaGuinea-BissauGuyanaHaitiHeavily indebted poor countries (HIPC)High incomeHondurasHungaryIcelandIDA blendIDA onlyIDA totalIndonesiaIraqIrelandIsraelItalyJamaicaJapanKazakhstanKenyaKorea, Rep.KosovoKuwaitKyrgyz RepublicLatin America & Caribbean Latin America & Caribbean (excluding high income)Latin America & the Caribbean (IDA & IBRD countries)LatviaLeast developed countries: UN classificationLesothoLithuaniaLow incomeLuxembourgMacao SAR, ChinaMacedonia, FYRMalaysiaMaldivesMaliMaltaMauritiusMexicoMiddle East & North AfricaMiddle East & North Africa (excluding high income)Middle East & North Africa (IDA & IBRD countries)MoldovaMongoliaMoroccoMozambiqueMyanmarNamibiaNepalNetherlandsNicaraguaNigerNigeriaNorth AmericaNorwayOECD membersOmanOther small statesPacific island small statesPakistanPanamaPapua New GuineaParaguayPhilippinesPolandPortugalPost-demographic dividendPre-demographic dividendQatarRomaniaRussian FederationRwandaSamoaSao Tome and PrincipeSenegalSerbiaSeychellesSierra LeoneSlovak RepublicSloveniaSmall statesSolomon IslandsSouth AfricaSouth SudanSpainSri LankaSt. Kitts and NevisSt. LuciaSt. Vincent and the GrenadinesSub-Saharan Africa Sub-Saharan Africa (excluding high income)Sub-Saharan Africa (IDA & IBRD countries)SudanSurinameSwazilandSwedenSyrian Arab RepublicTajikistanTanzaniaThailandTimor-LesteTogoTongaTrinidad and TobagoTurkeyUgandaUkraineUnited Arab EmiratesUnited StatesUruguayVanuatuVenezuela, RBWest Bank and GazaWorldZambia

Linea del tempo:

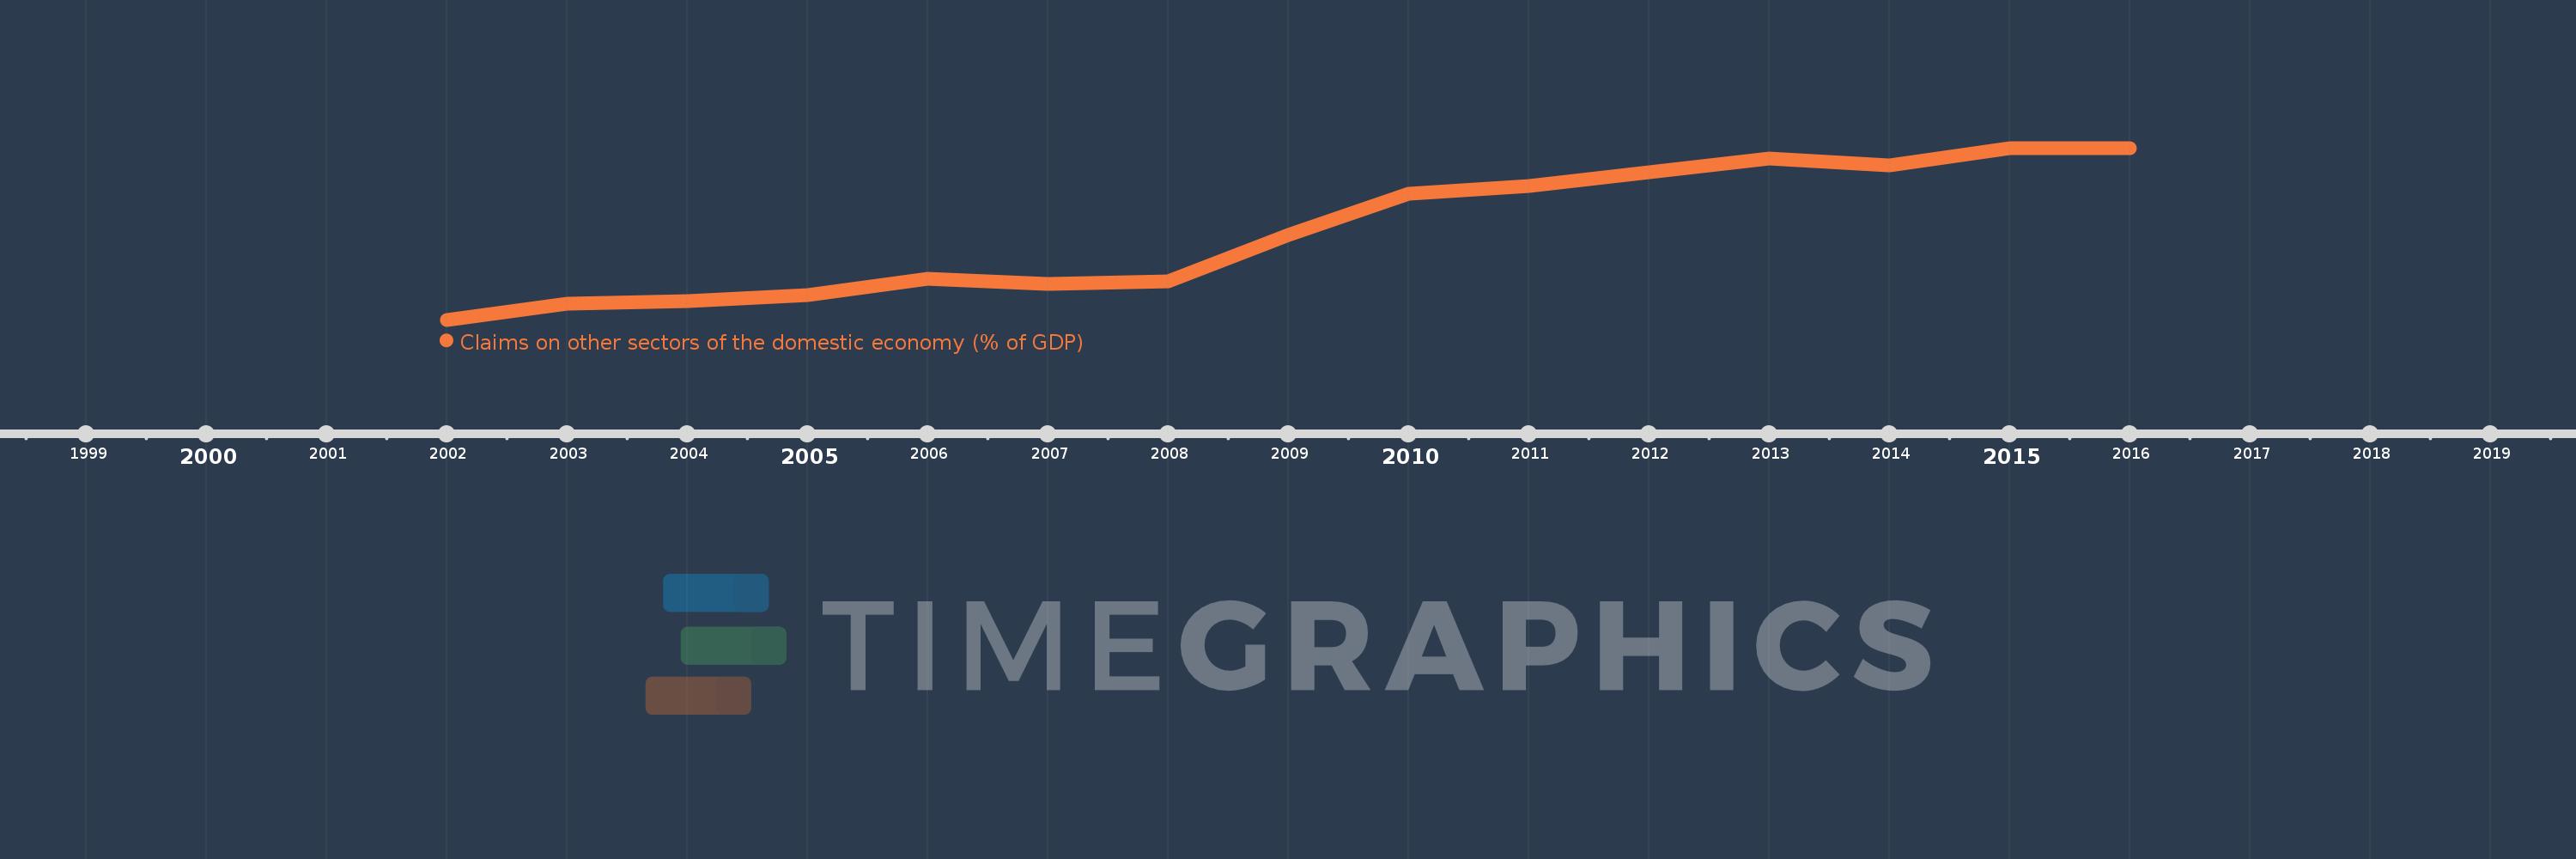
Questa scala temporale mostra un grafico dal 2002 anno al 2016 anno. Vanuatu. I dati fino ad 2001 anno non disponibili. Il numero di osservazioni attuali secondo i date: 15.

La fonte (nome):

Indicatori dello sviluppo mondiale

La fonte (organizzazione):

International Monetary Fund, International Financial Statistics and data files, and World Bank and OECD GDP estimates.

Categorie:

Financial Sector

sono stati aggiornati

23 apr 2017 anni

Indicatori delle variazioni dei valori per anni

In media:
54.533
Minima:
34.379
1 gen 2002 anni
Massimo:
73.564
1 gen 2015 anni
Alla data di osservazione
Valore
Variazione assoluta
La variazione rispetto al valore precedente
1 gen 2002 anni
34.379
+34.379
0.0%
1 gen 2003 anni
38.094
+3.715
10.81%
1 gen 2004 anni
38.694
+0.599
1.57%
1 gen 2005 anni
39.92
+1.227
3.17%
1 gen 2006 anni
43.697
+3.776
9.46%
1 gen 2007 anni
42.634
-1.063
-2.43%
1 gen 2008 anni
43.116
+0.482
1.13%
1 gen 2009 anni
53.634
+10.518
24.4%
1 gen 2010 anni
63.168
+9.534
17.78%
1 gen 2011 anni
64.849
+1.681
2.66%
1 gen 2012 anni
68.055
+3.206
4.94%
1 gen 2013 anni
71.078
+3.024
4.44%
1 gen 2014 anni
69.649
-1.429
-2.01%
1 gen 2015 anni
73.564
+3.915
5.62%
1 gen 2016 anni
73.469
-0.095
-0.13%

Classificazione dei paesi secondo i statistiche attuali per anni