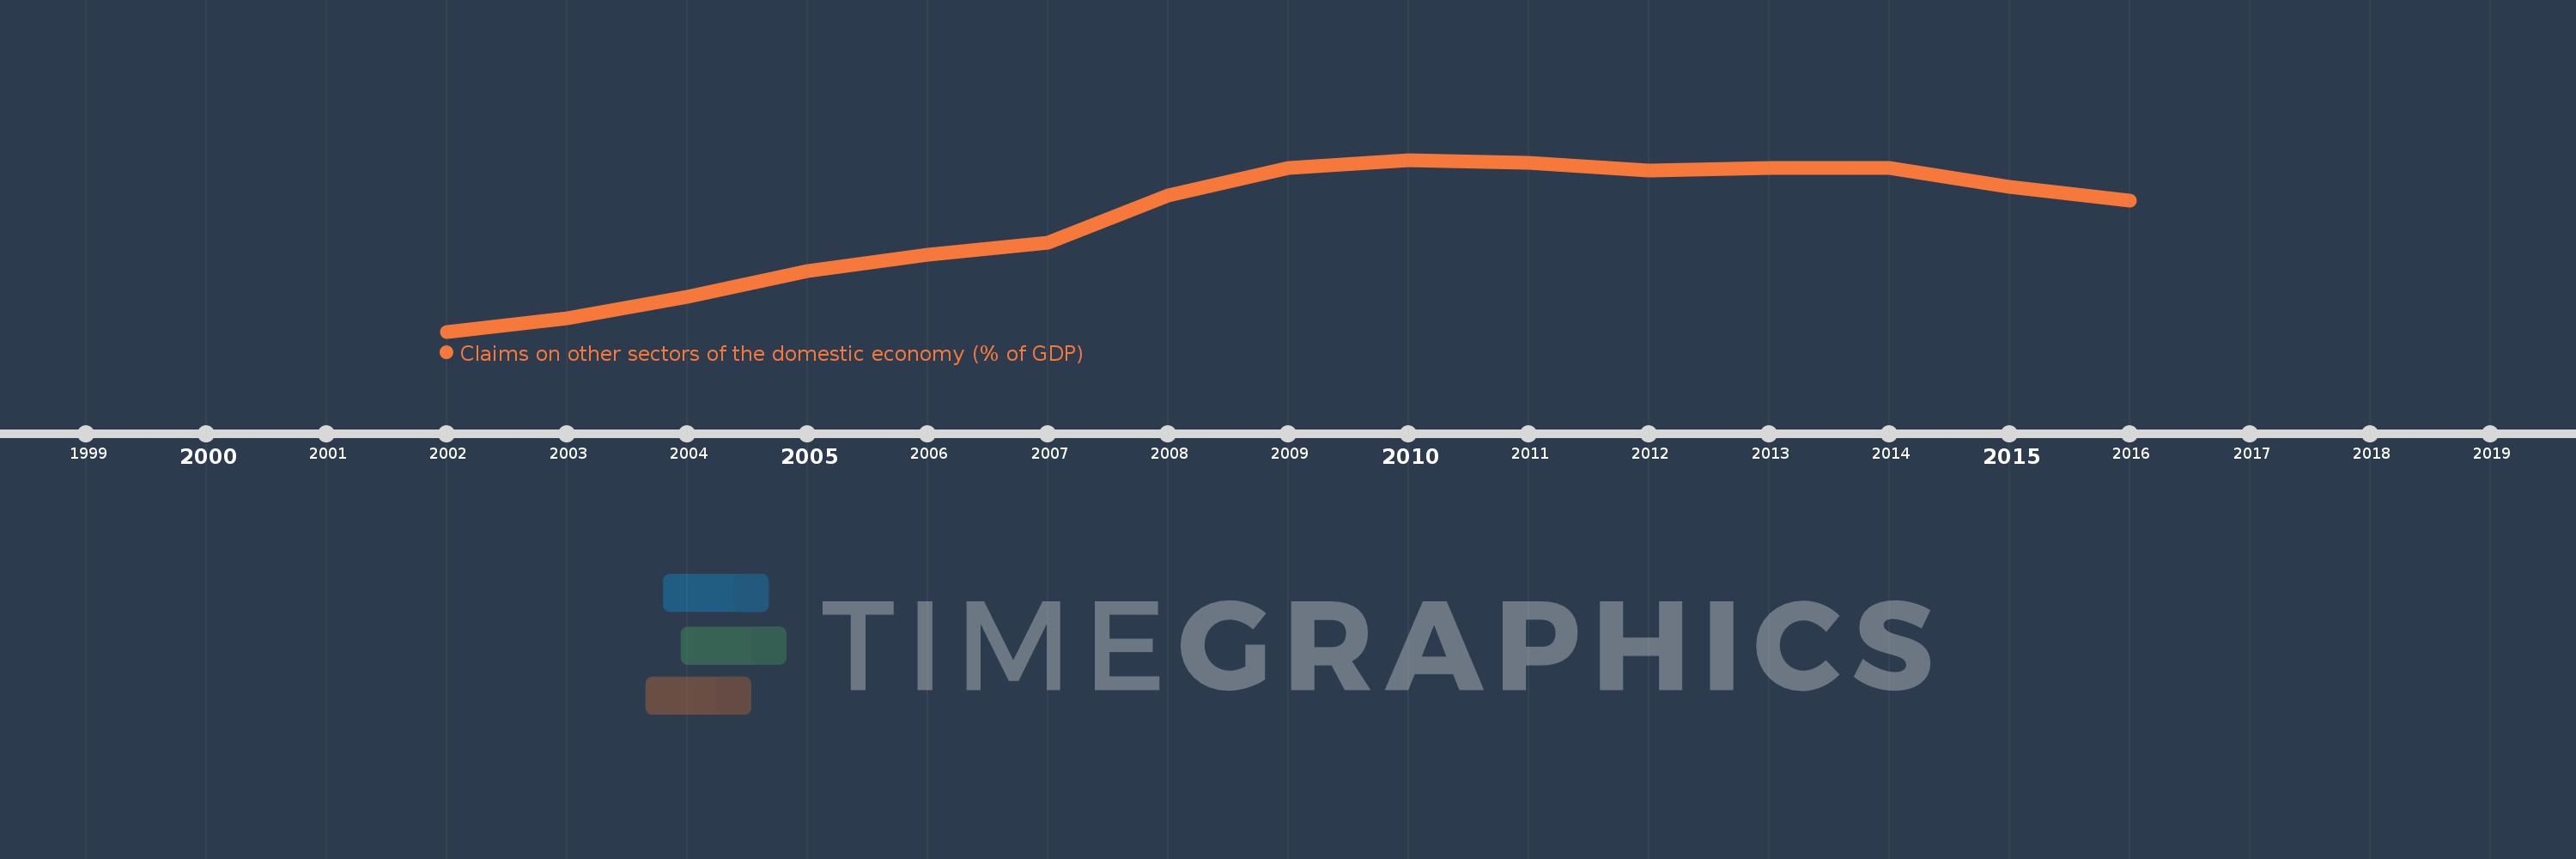
Questa scala temporale mostra un grafico dal 2002 anno al 2016 anno. Bulgaria. I dati fino ad 2001 anno non disponibili. Il numero di osservazioni attuali secondo i date: 15.
La fonte (nome):
Indicatori dello sviluppo mondiale
La fonte (organizzazione):
International Monetary Fund, International Financial Statistics and data files, and World Bank and OECD GDP estimates.
Categorie:
Financial Sector
sono stati aggiornati
23 apr 2017 anni
Indicatori delle variazioni dei valori per anni
In media:
51.488
Minima:
14.515
1 gen 2002 anni
Massimo:
71.291
1 gen 2010 anni
Alla data di osservazione
Valore
Variazione assoluta
La variazione rispetto al valore precedente
1 gen 2002 anni
14.515
+14.515
0.0%
1 gen 2003 anni
18.863
+4.348
29.95%
1 gen 2004 anni
26.055
+7.193
38.13%
1 gen 2005 anni
34.544
+8.488
32.58%
1 gen 2006 anni
39.94
+5.396
15.62%
1 gen 2007 anni
43.765
+3.825
9.58%
1 gen 2008 anni
59.43
+15.665
35.79%
1 gen 2009 anni
68.464
+9.034
15.2%
1 gen 2010 anni
71.291
+2.827
4.13%
1 gen 2011 anni
70.437
-0.854
-1.2%
1 gen 2012 anni
67.801
-2.636
-3.74%
1 gen 2013 anni
68.568
+0.767
1.13%
1 gen 2014 anni
68.53
-0.038
-0.06%
1 gen 2015 anni
62.236
-6.294
-9.18%
1 gen 2016 anni
57.876
-4.36
-7.01%
Classificazione dei paesi secondo i statistiche attuali per anni