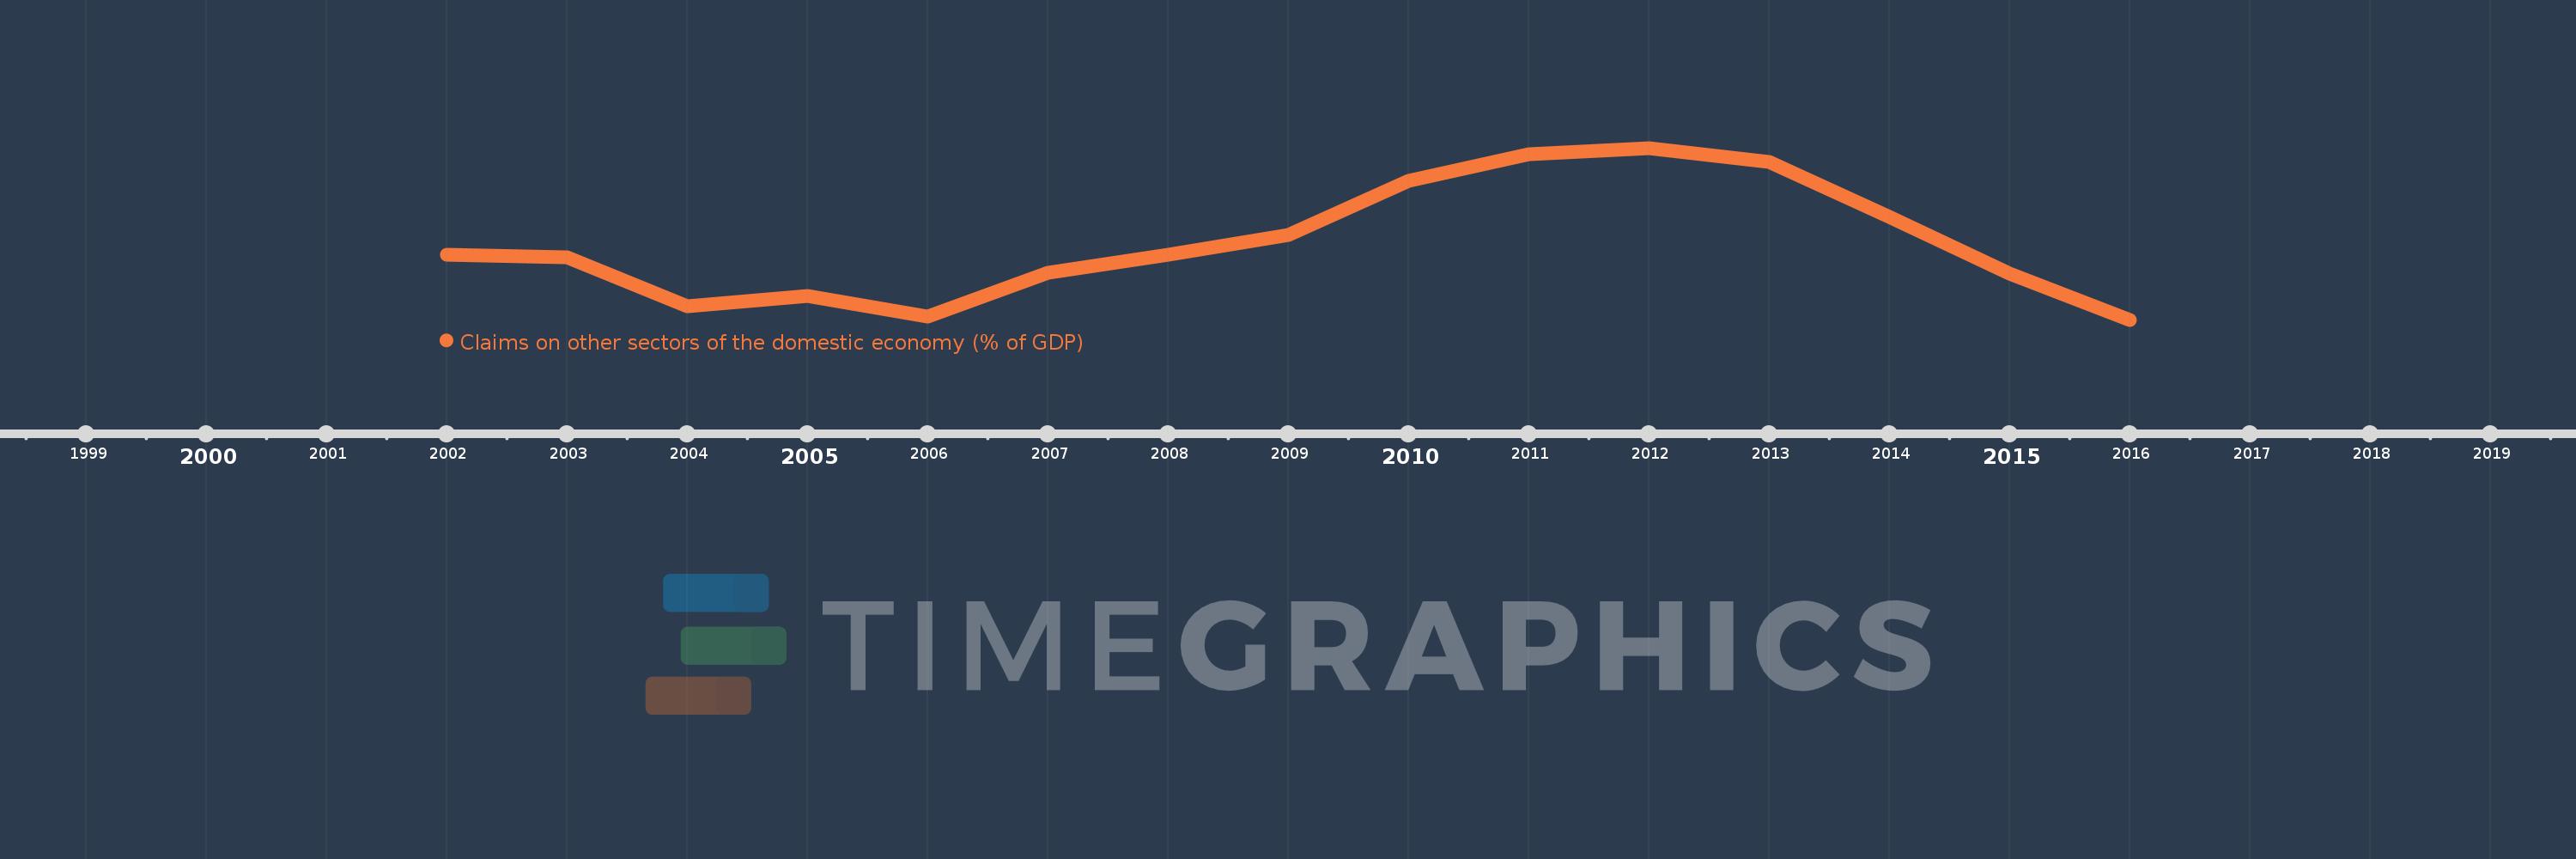
Questa scala temporale mostra un grafico dal 2002 anno al 2016 anno. Grenada. I dati fino ad 2001 anno non disponibili. Il numero di osservazioni attuali secondo i date: 15.
La fonte (nome):
Indicatori dello sviluppo mondiale
La fonte (organizzazione):
International Monetary Fund, International Financial Statistics and data files, and World Bank and OECD GDP estimates.
Categorie:
Financial Sector
sono stati aggiornati
23 apr 2017 anni
Indicatori delle variazioni dei valori per anni
In media:
72.765
Minima:
60.136
1 gen 2016 anni
Massimo:
88.507
1 gen 2012 anni
Alla data di osservazione
Valore
Variazione assoluta
La variazione rispetto al valore precedente
1 gen 2002 anni
70.811
+70.811
0.0%
1 gen 2003 anni
70.458
-0.353
-0.5%
1 gen 2004 anni
62.306
-8.153
-11.57%
1 gen 2005 anni
64.102
+1.796
2.88%
1 gen 2006 anni
60.638
-3.464
-5.4%
1 gen 2007 anni
67.877
+7.239
11.94%
1 gen 2008 anni
70.85
+2.973
4.38%
1 gen 2009 anni
74.151
+3.301
4.66%
1 gen 2010 anni
83.092
+8.941
12.06%
1 gen 2011 anni
87.542
+4.449
5.35%
1 gen 2012 anni
88.507
+0.965
1.1%
1 gen 2013 anni
86.224
-2.283
-2.58%
1 gen 2014 anni
77.067
-9.157
-10.62%
1 gen 2015 anni
67.718
-9.35
-12.13%
1 gen 2016 anni
60.136
-7.582
-11.2%
Classificazione dei paesi secondo i statistiche attuali per anni