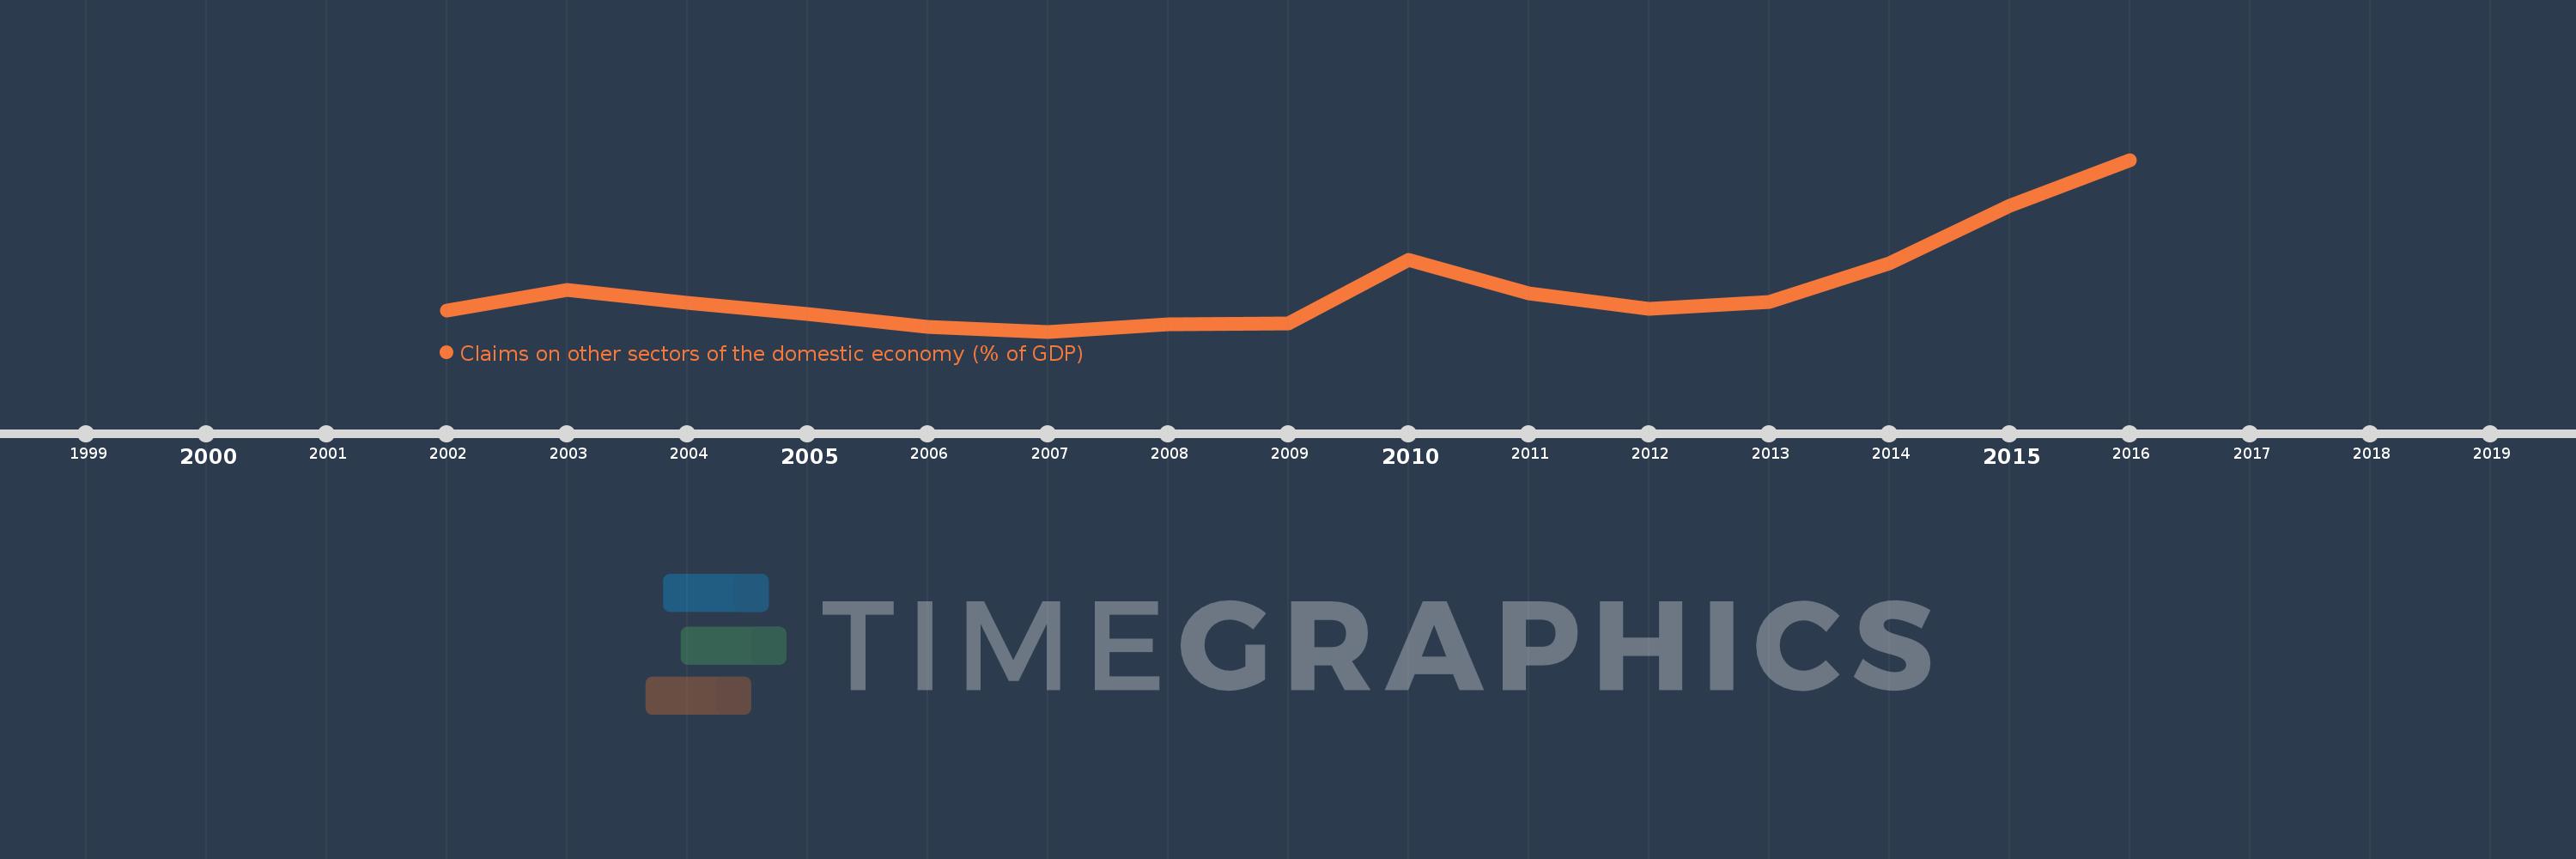
Questa scala temporale mostra un grafico dal 2002 anno al 2016 anno. Algeria. I dati fino ad 2001 anno non disponibili. Il numero di osservazioni attuali secondo i date: 15.
La fonte (nome):
Indicatori dello sviluppo mondiale
La fonte (organizzazione):
International Monetary Fund, International Financial Statistics and data files, and World Bank and OECD GDP estimates.
Categorie:
Financial Sector
sono stati aggiornati
23 apr 2017 anni
Indicatori delle variazioni dei valori per anni
In media:
28.596
Minima:
23.334
1 gen 2007 anni
Massimo:
43.945
1 gen 2016 anni
Alla data di osservazione
Valore
Variazione assoluta
La variazione rispetto al valore precedente
1 gen 2002 anni
25.813
+25.813
0.0%
1 gen 2003 anni
28.377
+2.564
9.93%
1 gen 2004 anni
26.803
-1.575
-5.55%
1 gen 2005 anni
25.444
-1.359
-5.07%
1 gen 2006 anni
23.938
-1.506
-5.92%
1 gen 2007 anni
23.334
-0.604
-2.52%
1 gen 2008 anni
24.181
+0.847
3.63%
1 gen 2009 anni
24.352
+0.171
0.71%
1 gen 2010 anni
31.972
+7.62
31.29%
1 gen 2011 anni
27.923
-4.05
-12.67%
1 gen 2012 anni
26.045
-1.878
-6.72%
1 gen 2013 anni
26.934
+0.889
3.41%
1 gen 2014 anni
31.495
+4.561
16.93%
1 gen 2015 anni
38.386
+6.891
21.88%
1 gen 2016 anni
43.945
+5.559
14.48%
Classificazione dei paesi secondo i statistiche attuali per anni