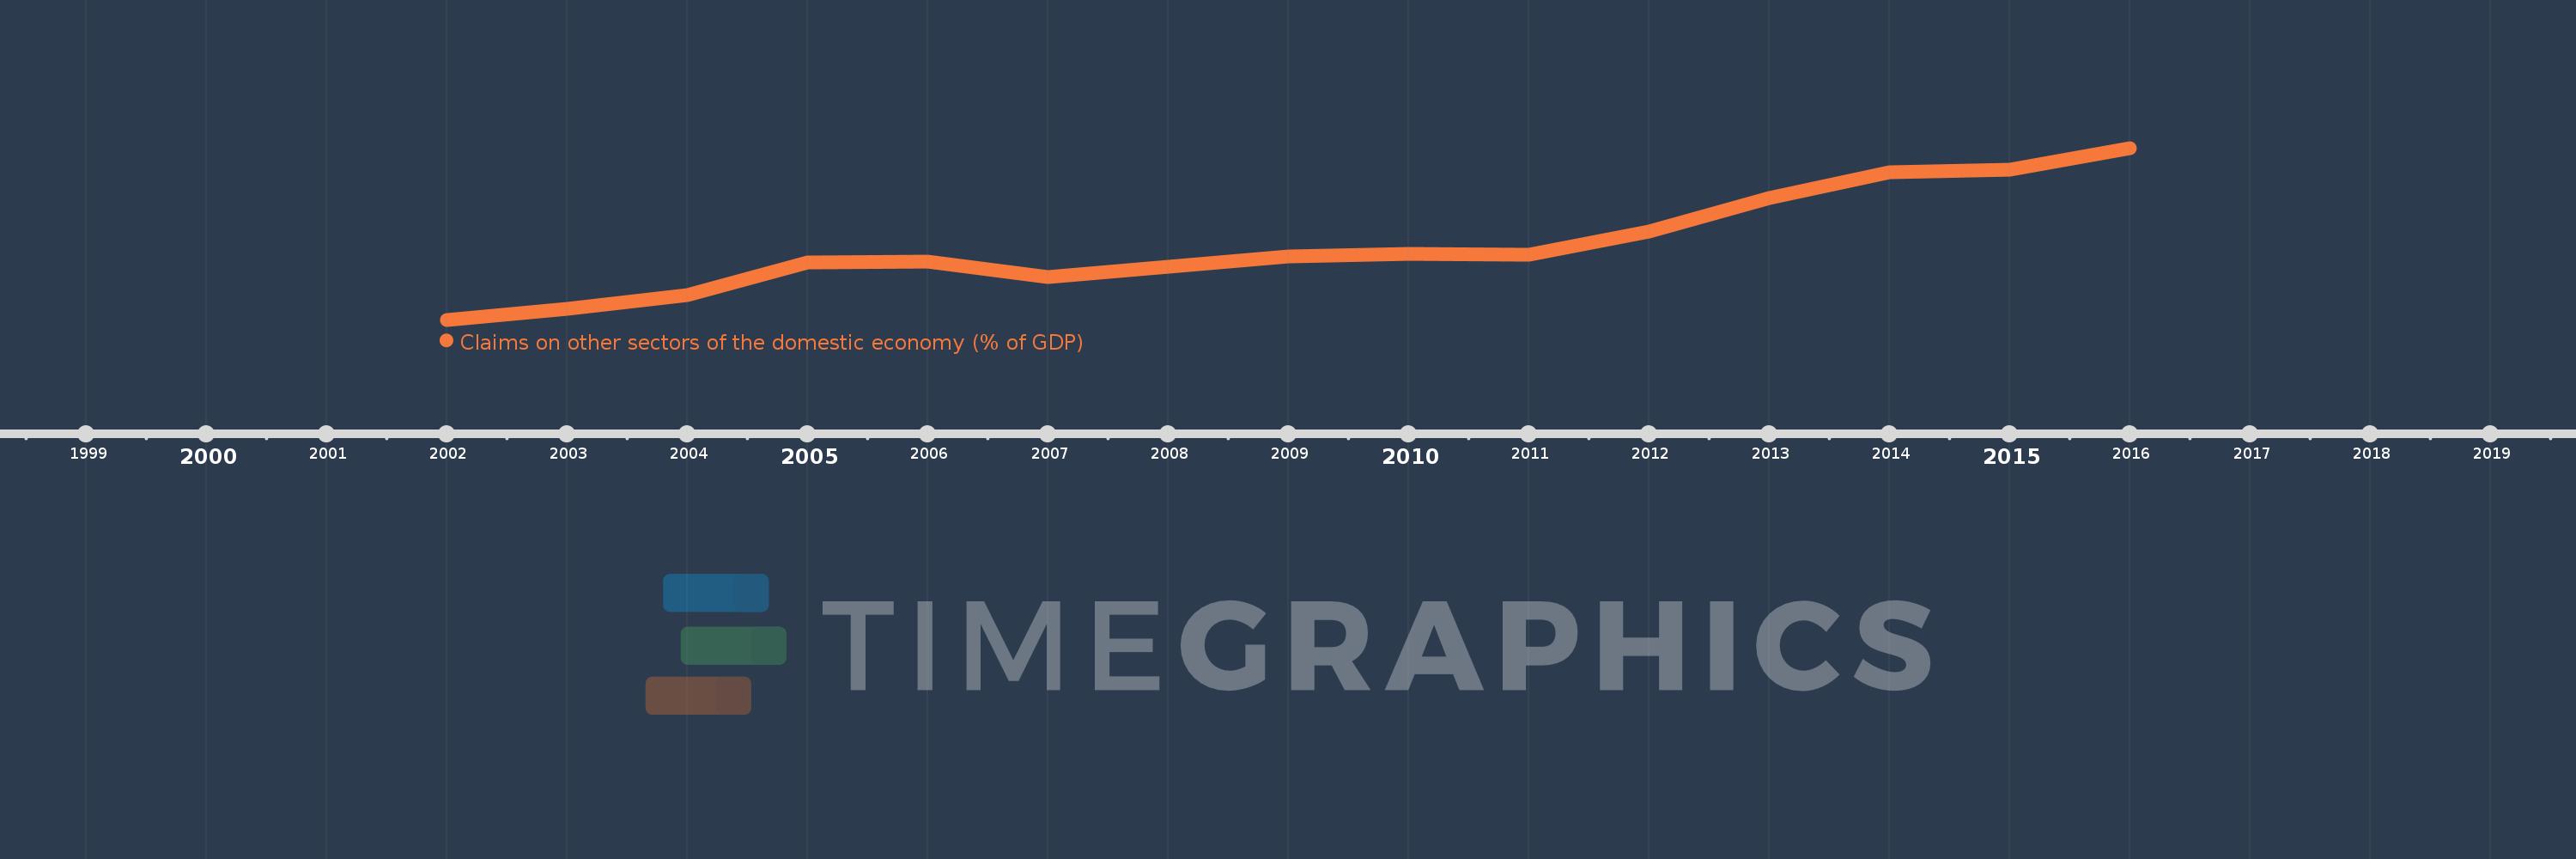
Questa scala temporale mostra un grafico dal 2002 anno al 2016 anno. Indonesia. I dati fino ad 2001 anno non disponibili. Il numero di osservazioni attuali secondo i date: 15.
La fonte (nome):
Indicatori dello sviluppo mondiale
La fonte (organizzazione):
International Monetary Fund, International Financial Statistics and data files, and World Bank and OECD GDP estimates.
Categorie:
Financial Sector
sono stati aggiornati
23 apr 2017 anni
Indicatori delle variazioni dei valori per anni
In media:
29.863
Minima:
21.284
1 gen 2002 anni
Massimo:
41.013
1 gen 2016 anni
Alla data di osservazione
Valore
Variazione assoluta
La variazione rispetto al valore precedente
1 gen 2002 anni
21.284
+21.284
0.0%
1 gen 2003 anni
22.558
+1.274
5.99%
1 gen 2004 anni
24.079
+1.521
6.74%
1 gen 2005 anni
27.831
+3.752
15.58%
1 gen 2006 anni
27.959
+0.128
0.46%
1 gen 2007 anni
26.217
-1.742
-6.23%
1 gen 2008 anni
27.353
+1.137
4.34%
1 gen 2009 anni
28.558
+1.205
4.4%
1 gen 2010 anni
28.865
+0.307
1.07%
1 gen 2011 anni
28.724
-0.141
-0.49%
1 gen 2012 anni
31.41
+2.686
9.35%
1 gen 2013 anni
35.305
+3.895
12.4%
1 gen 2014 anni
38.267
+2.962
8.39%
1 gen 2015 anni
38.521
+0.254
0.66%
1 gen 2016 anni
41.013
+2.493
6.47%
Classificazione dei paesi secondo i statistiche attuali per anni