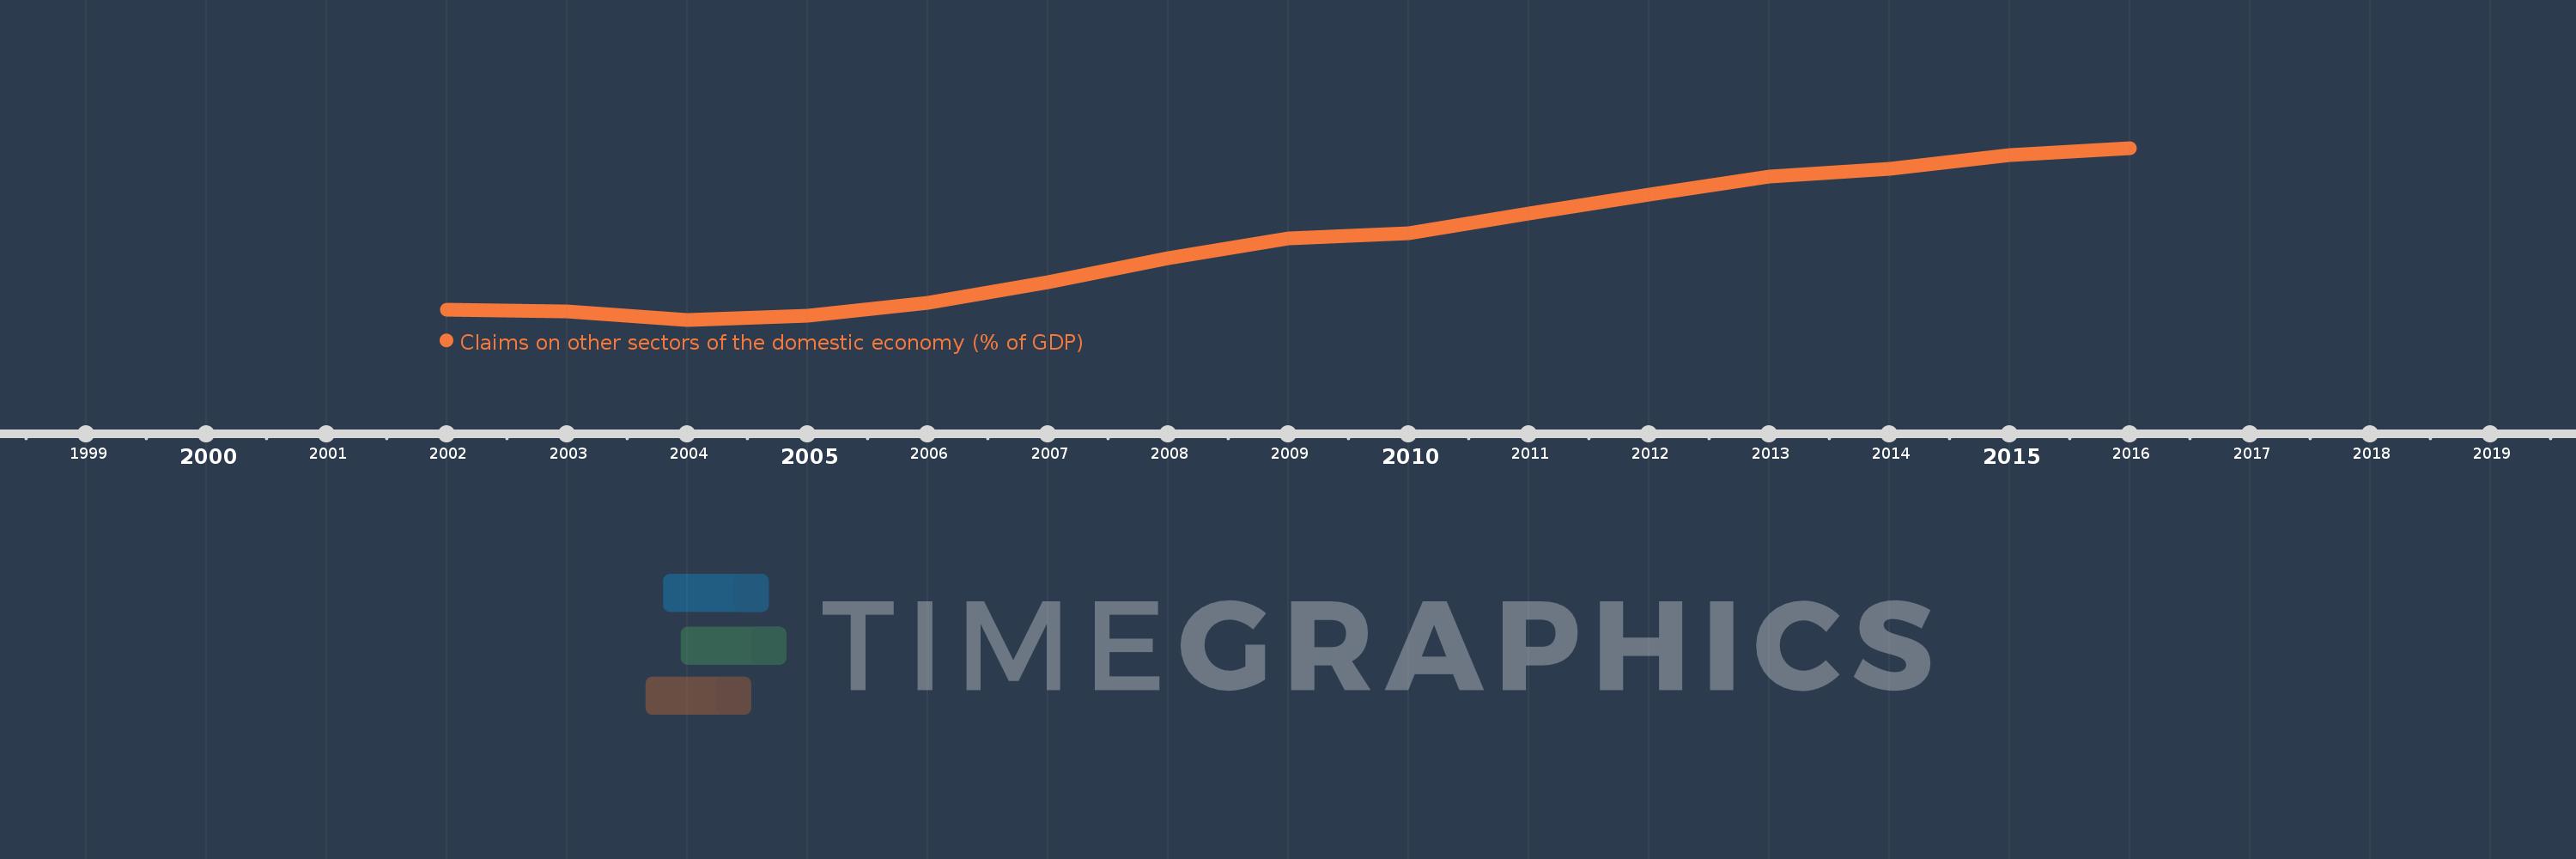
Questa scala temporale mostra un grafico dal 2002 anno al 2016 anno. Brazil. I dati fino ad 2001 anno non disponibili. Il numero di osservazioni attuali secondo i date: 15.
La fonte (nome):
Indicatori dello sviluppo mondiale
La fonte (organizzazione):
International Monetary Fund, International Financial Statistics and data files, and World Bank and OECD GDP estimates.
Categorie:
Financial Sector
sono stati aggiornati
23 apr 2017 anni
Indicatori delle variazioni dei valori per anni
In media:
53.557
Minima:
30.667
1 gen 2004 anni
Massimo:
81.147
1 gen 2016 anni
Alla data di osservazione
Valore
Variazione assoluta
La variazione rispetto al valore precedente
1 gen 2002 anni
33.541
+33.541
0.0%
1 gen 2003 anni
33.196
-0.345
-1.03%
1 gen 2004 anni
30.667
-2.529
-7.62%
1 gen 2005 anni
31.895
+1.228
4.01%
1 gen 2006 anni
35.685
+3.79
11.88%
1 gen 2007 anni
41.632
+5.947
16.67%
1 gen 2008 anni
48.872
+7.24
17.39%
1 gen 2009 anni
54.566
+5.693
11.65%
1 gen 2010 anni
56.035
+1.47
2.69%
1 gen 2011 anni
61.846
+5.811
10.37%
1 gen 2012 anni
67.546
+5.699
9.22%
1 gen 2013 anni
72.782
+5.236
7.75%
1 gen 2014 anni
75.021
+2.239
3.08%
1 gen 2015 anni
78.93
+3.91
5.21%
1 gen 2016 anni
81.147
+2.217
2.81%
Classificazione dei paesi secondo i statistiche attuali per anni