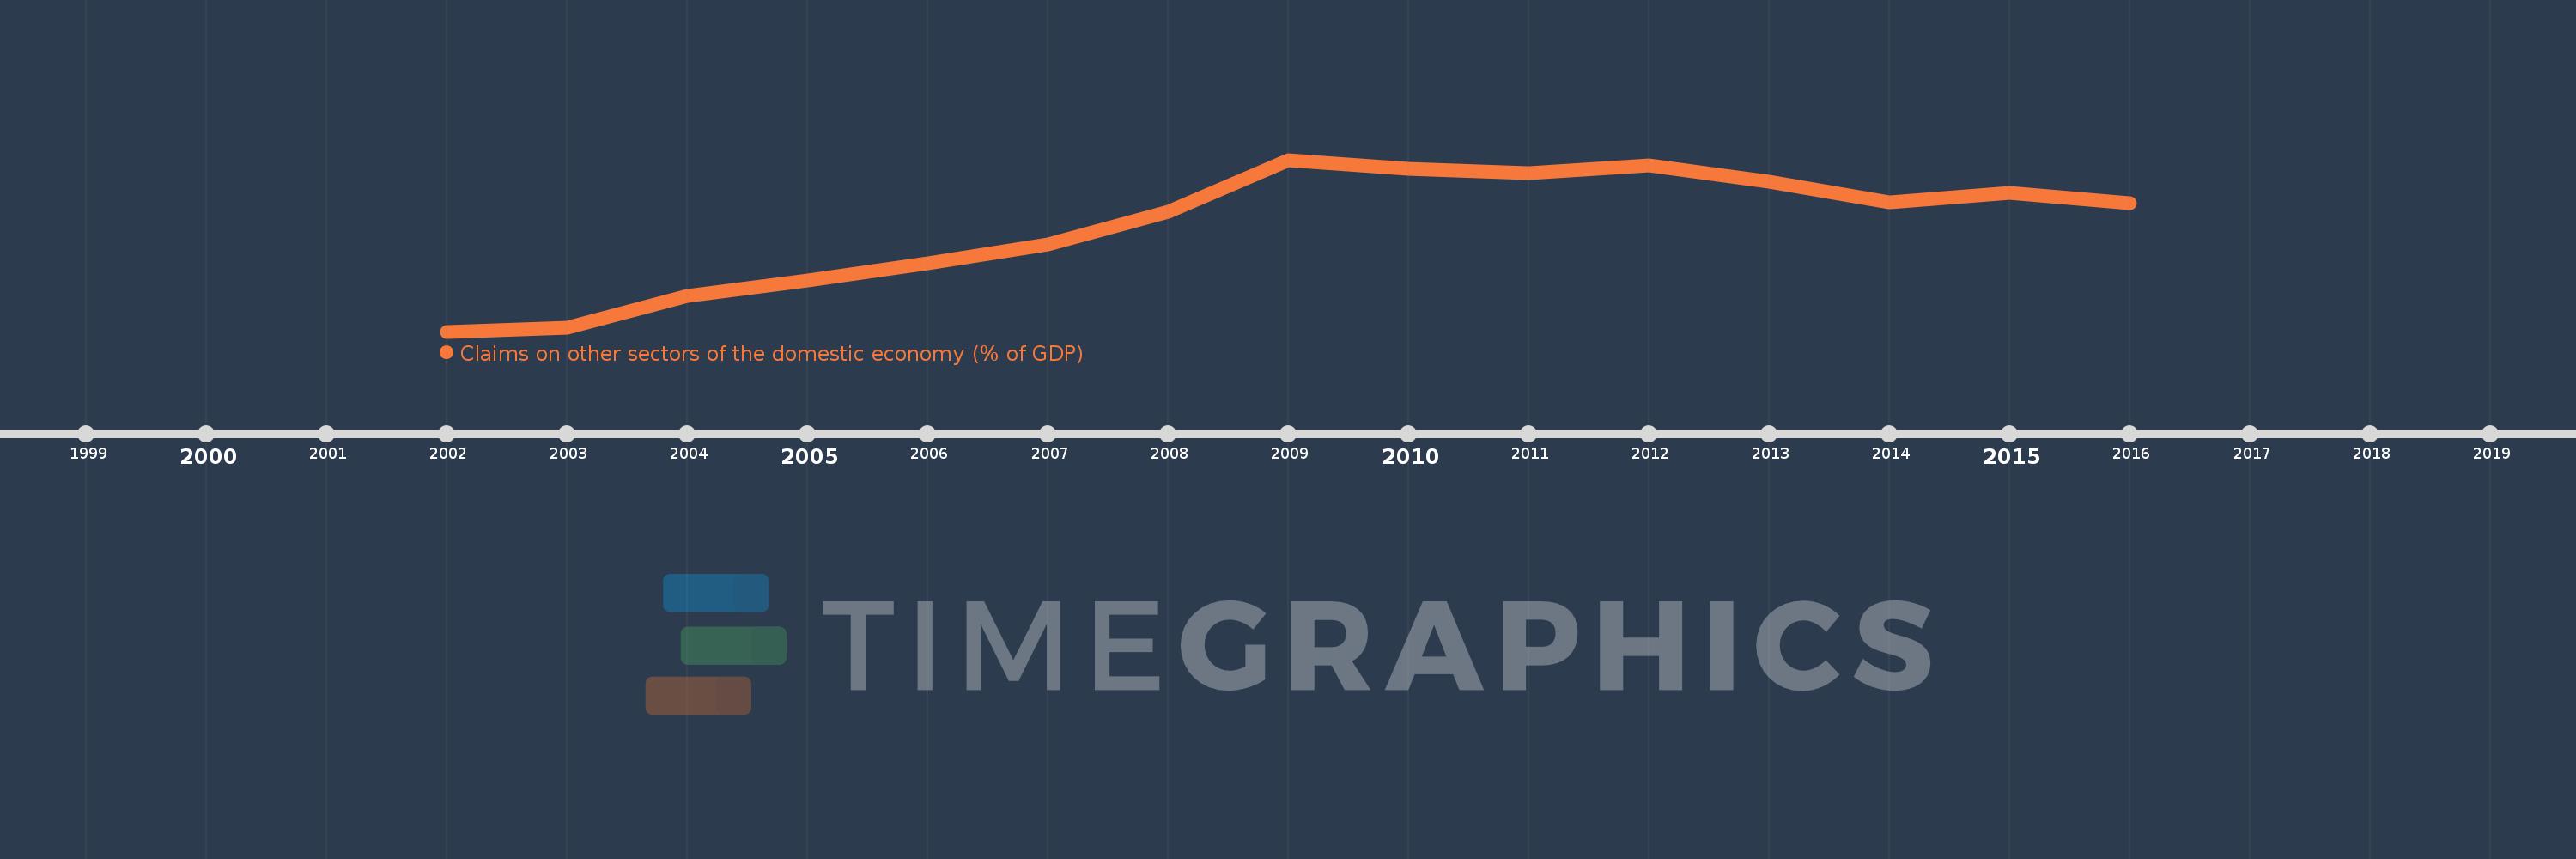
Questa scala temporale mostra un grafico dal 2002 anno al 2016 anno. Denmark. I dati fino ad 2001 anno non disponibili. Il numero di osservazioni attuali secondo i date: 15.
La fonte (nome):
Indicatori dello sviluppo mondiale
La fonte (organizzazione):
International Monetary Fund, International Financial Statistics and data files, and World Bank and OECD GDP estimates.
Categorie:
Financial Sector
sono stati aggiornati
23 apr 2017 anni
Indicatori delle variazioni dei valori per anni
In media:
208.278
Minima:
138.83
1 gen 2002 anni
Massimo:
252.8
1 gen 2009 anni
Alla data di osservazione
Valore
Variazione assoluta
La variazione rispetto al valore precedente
1 gen 2002 anni
138.83
+138.83
0.0%
1 gen 2003 anni
141.603
+2.773
2.0%
1 gen 2004 anni
162.212
+20.609
14.55%
1 gen 2005 anni
172.594
+10.382
6.4%
1 gen 2006 anni
184.219
+11.624
6.74%
1 gen 2007 anni
196.641
+12.422
6.74%
1 gen 2008 anni
218.138
+21.497
10.93%
1 gen 2009 anni
252.8
+34.662
15.89%
1 gen 2010 anni
246.799
-6.001
-2.37%
1 gen 2011 anni
243.794
-3.005
-1.22%
1 gen 2012 anni
249.178
+5.383
2.21%
1 gen 2013 anni
238.203
-10.975
-4.4%
1 gen 2014 anni
224.378
-13.825
-5.8%
1 gen 2015 anni
230.698
+6.32
2.82%
1 gen 2016 anni
224.084
-6.614
-2.87%
Classificazione dei paesi secondo i statistiche attuali per anni