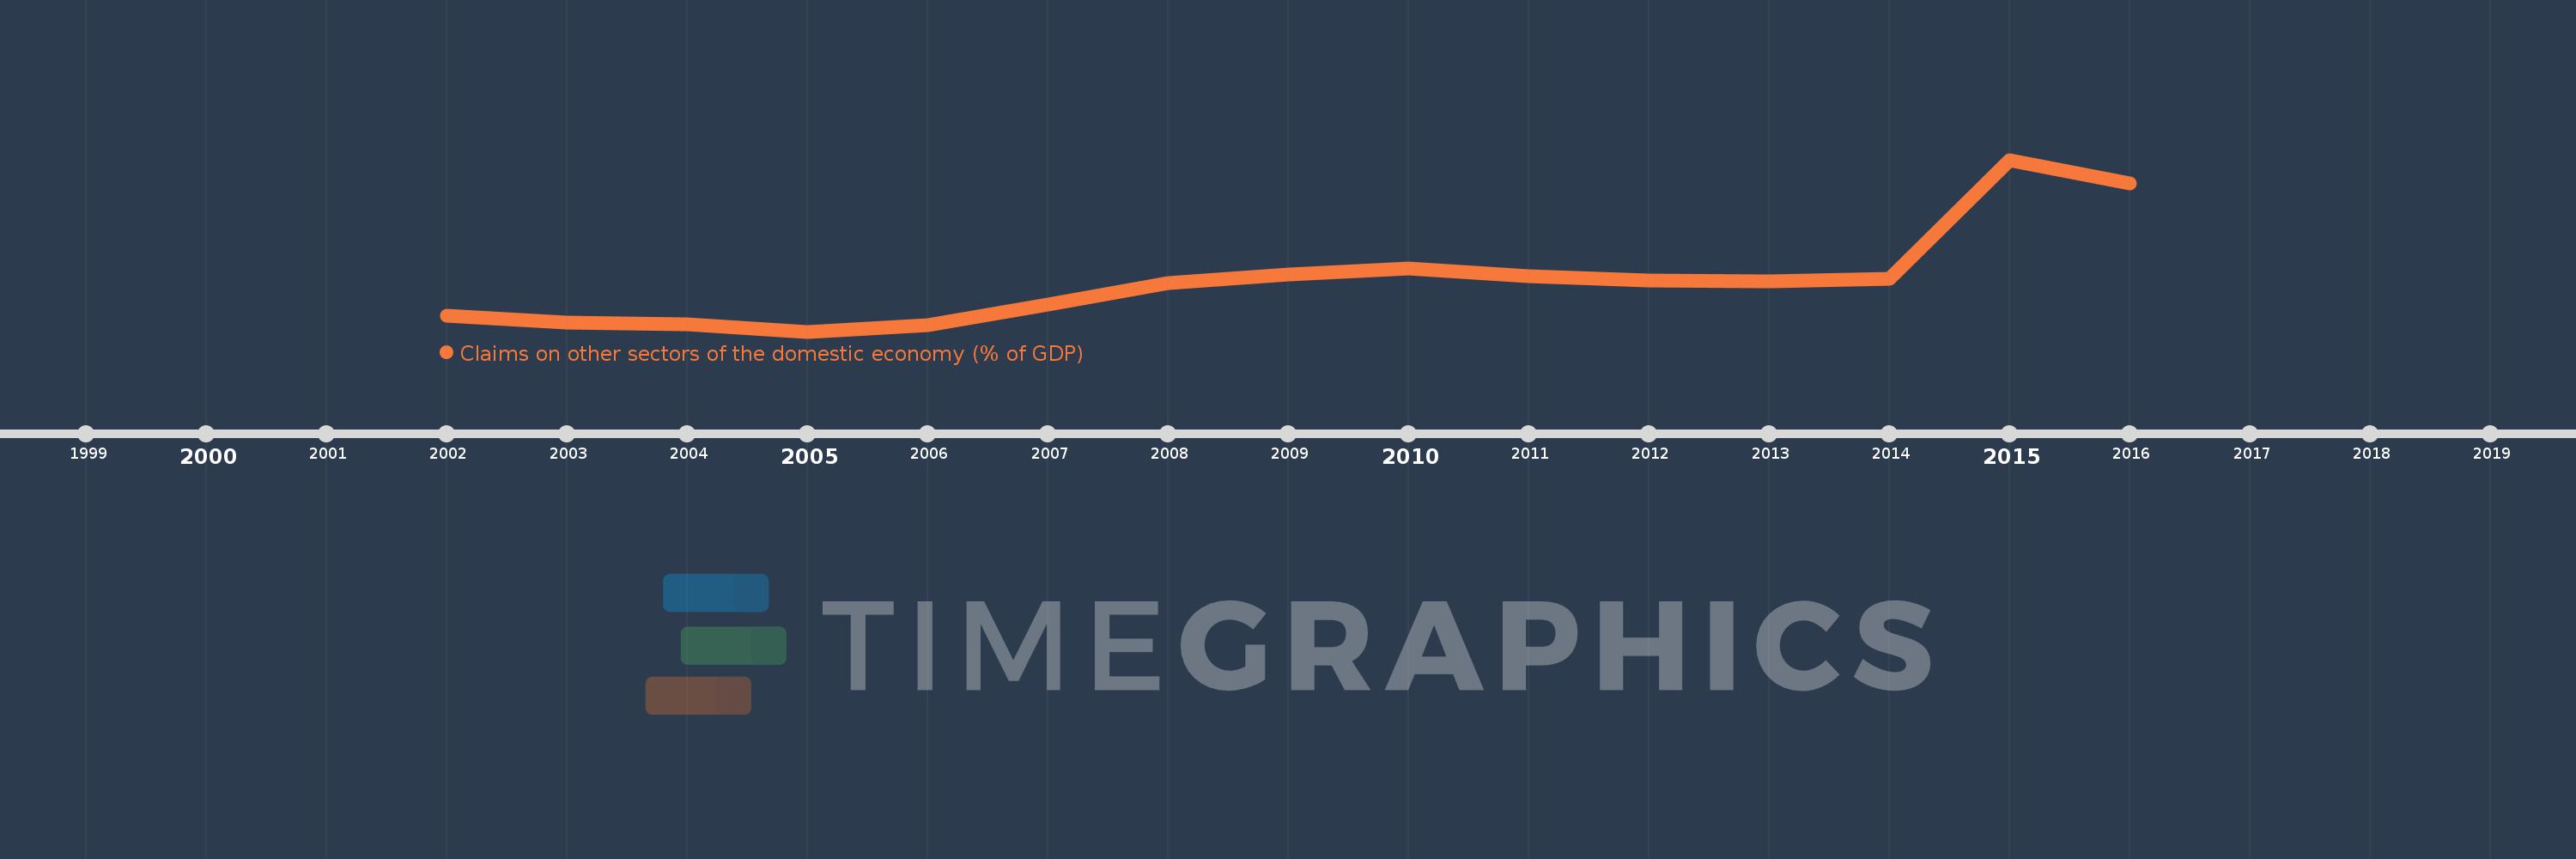
Questa scala temporale mostra un grafico dal 2002 anno al 2016 anno. Belgium. I dati fino ad 2001 anno non disponibili. Il numero di osservazioni attuali secondo i date: 15.
La fonte (nome):
Indicatori dello sviluppo mondiale
La fonte (organizzazione):
International Monetary Fund, International Financial Statistics and data files, and World Bank and OECD GDP estimates.
Categorie:
Financial Sector
sono stati aggiornati
23 apr 2017 anni
Indicatori delle variazioni dei valori per anni
In media:
96.11
Minima:
77.509
1 gen 2005 anni
Massimo:
140.193
1 gen 2015 anni
Alla data di osservazione
Valore
Variazione assoluta
La variazione rispetto al valore precedente
1 gen 2002 anni
83.459
+83.459
0.0%
1 gen 2003 anni
80.81
-2.649
-3.17%
1 gen 2004 anni
80.037
-0.773
-0.96%
1 gen 2005 anni
77.509
-2.527
-3.16%
1 gen 2006 anni
79.904
+2.395
3.09%
1 gen 2007 anni
87.535
+7.631
9.55%
1 gen 2008 anni
95.261
+7.726
8.83%
1 gen 2009 anni
98.342
+3.081
3.23%
1 gen 2010 anni
100.454
+2.112
2.15%
1 gen 2011 anni
97.594
-2.86
-2.85%
1 gen 2012 anni
96.247
-1.347
-1.38%
1 gen 2013 anni
95.89
-0.357
-0.37%
1 gen 2014 anni
96.844
+0.955
1.0%
1 gen 2015 anni
140.193
+43.349
44.76%
1 gen 2016 anni
131.576
-8.617
-6.15%
Classificazione dei paesi secondo i statistiche attuali per anni