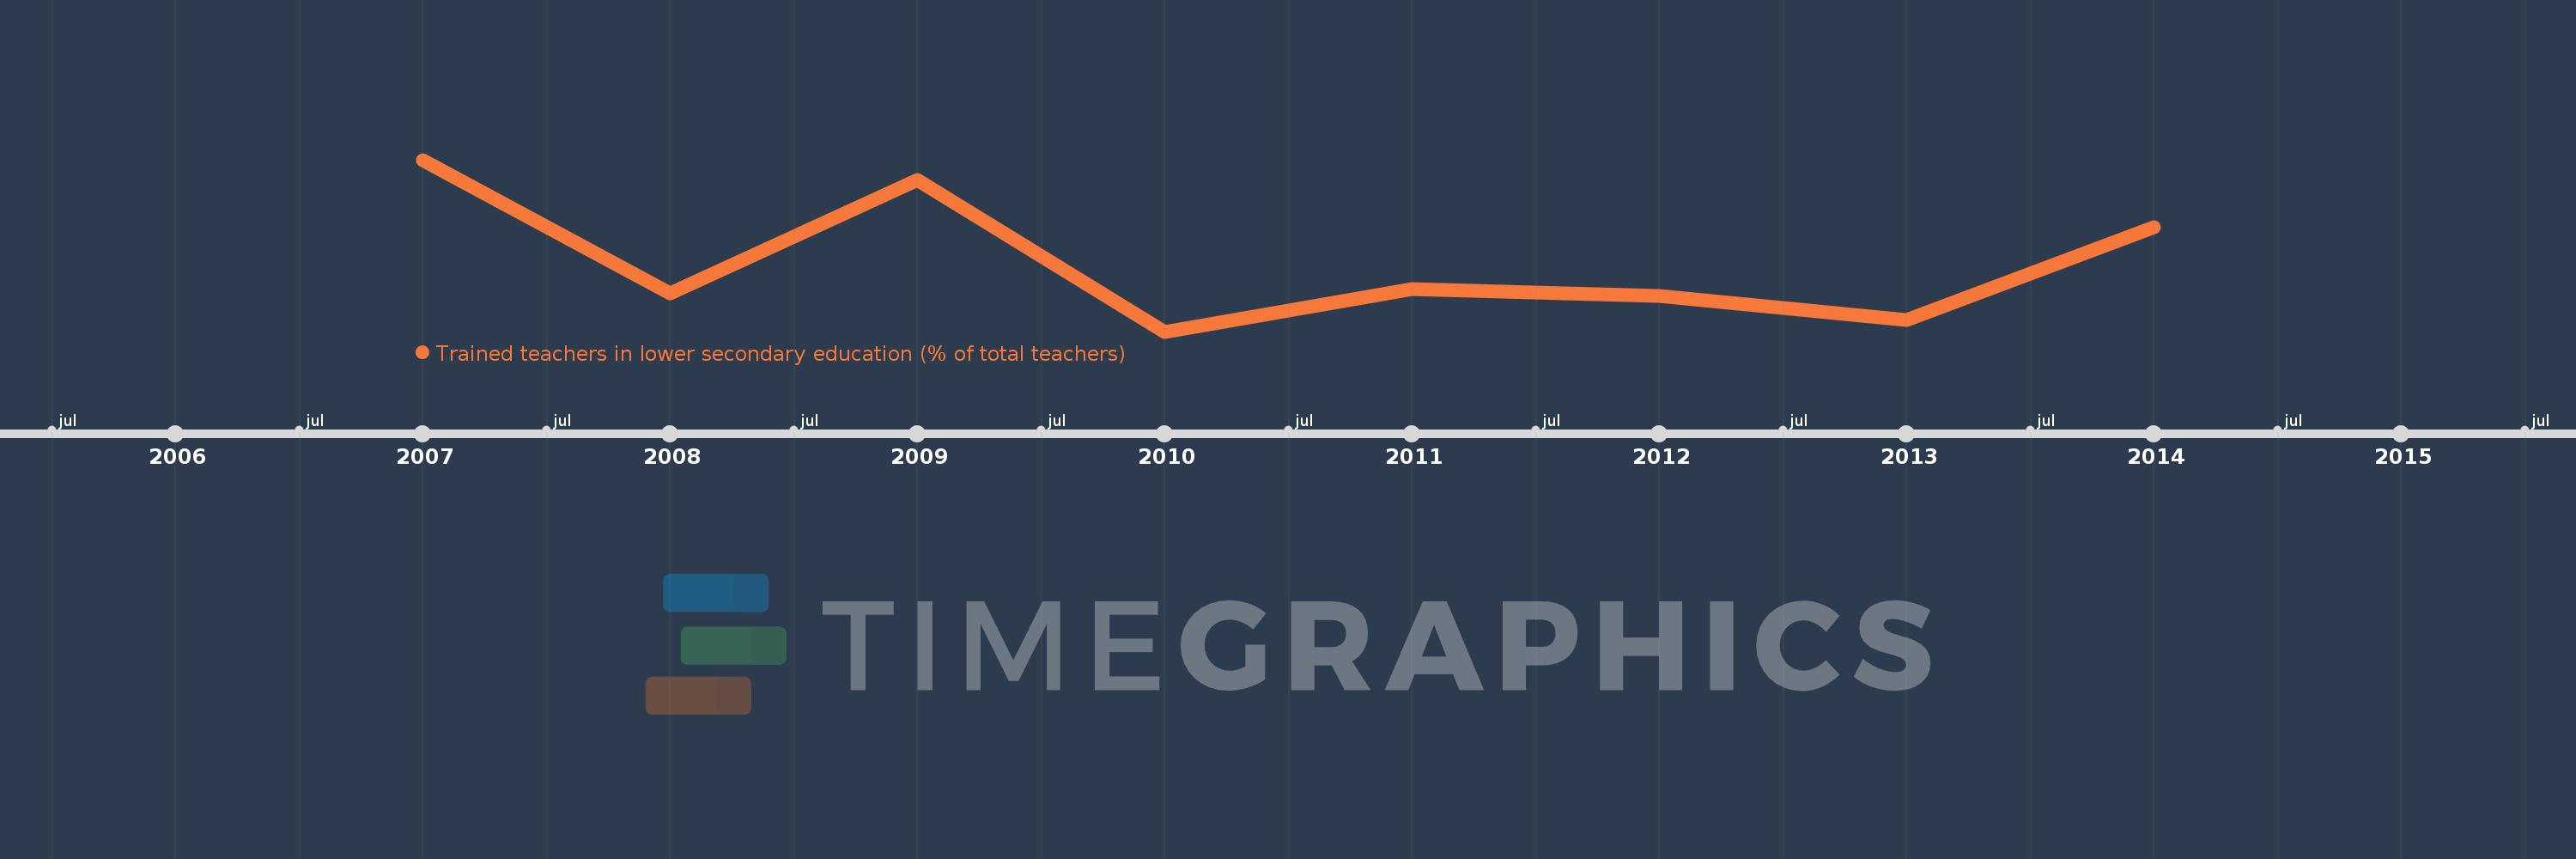
Questa scala temporale mostra un grafico dal 2007 anno al 2014 anno. Sub-Saharan Africa . I dati fino ad 2006 anno non disponibili. Il numero di osservazioni attuali secondo i date: 8.
La fonte (nome):
Indicatori dello sviluppo mondiale
La fonte (organizzazione):
United Nations Educational, Scientific, and Cultural Organization (UNESCO) Institute for Statistics.
Categorie:
Education
sono stati aggiornati
23 apr 2017 anni
Indicatori delle variazioni dei valori per anni
In media:
65.564
Minima:
61.285
1 gen 2010 anni
Massimo:
71.863
1 gen 2007 anni
Alla data di osservazione
Valore
Variazione assoluta
La variazione rispetto al valore precedente
1 gen 2007 anni
71.863
+71.863
0.0%
1 gen 2008 anni
63.642
-8.221
-11.44%
1 gen 2009 anni
70.622
+6.98
10.97%
1 gen 2010 anni
61.285
-9.337
-13.22%
1 gen 2011 anni
63.881
+2.596
4.24%
1 gen 2012 anni
63.495
-0.385
-0.6%
1 gen 2013 anni
61.999
-1.497
-2.36%
1 gen 2014 anni
67.726
+5.727
9.24%
Classificazione dei paesi secondo i statistiche attuali per anni