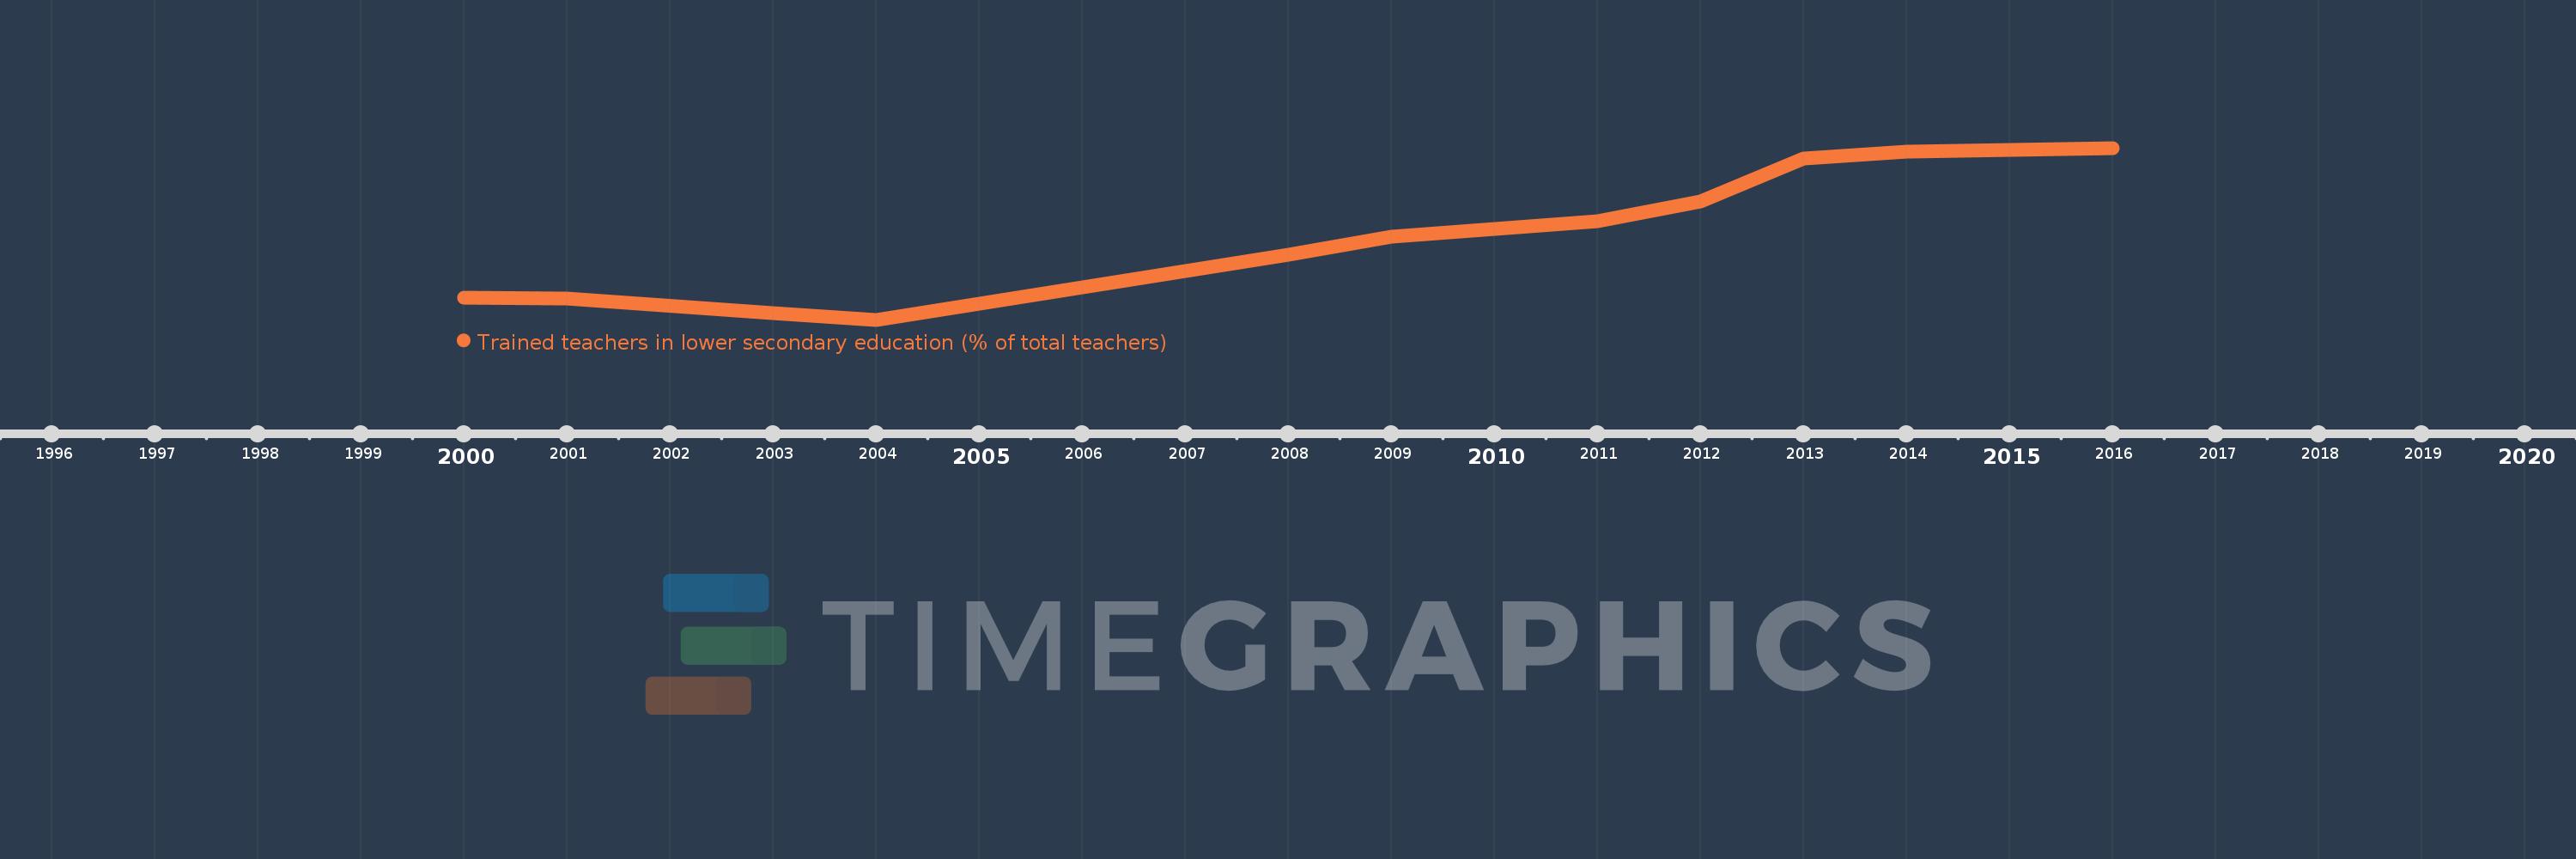
Questa scala temporale mostra un grafico dal 2000 anno al 2016 anno. Nepal. I dati fino ad 1999 anno non disponibili. Il numero di osservazioni attuali secondo i date: 12.
La fonte (nome):
Indicatori dello sviluppo mondiale
La fonte (organizzazione):
United Nations Educational, Scientific, and Cultural Organization (UNESCO) Institute for Statistics.
Categorie:
Education
sono stati aggiornati
23 apr 2017 anni
Indicatori delle variazioni dei valori per anni
In media:
54.652
Minima:
25.795
1 gen 2004 anni
Massimo:
80.58
1 gen 2016 anni
Alla data di osservazione
Valore
Variazione assoluta
La variazione rispetto al valore precedente
1 gen 2000 anni
32.795
+32.795
0.0%
1 gen 2001 anni
32.645
-0.15
-0.46%
1 gen 2003 anni
27.877
-4.768
-14.61%
1 gen 2004 anni
25.795
-2.081
-7.47%
1 gen 2008 anni
46.445
+20.65
80.05%
1 gen 2009 anni
52.346
+5.9
12.7%
1 gen 2011 anni
57.182
+4.837
9.24%
1 gen 2012 anni
63.575
+6.393
11.18%
1 gen 2013 anni
77.281
+13.705
21.56%
1 gen 2014 anni
79.408
+2.128
2.75%
1 gen 2015 anni
79.9
+0.492
0.62%
1 gen 2016 anni
80.58
+0.679
0.85%
Classificazione dei paesi secondo i statistiche attuali per anni