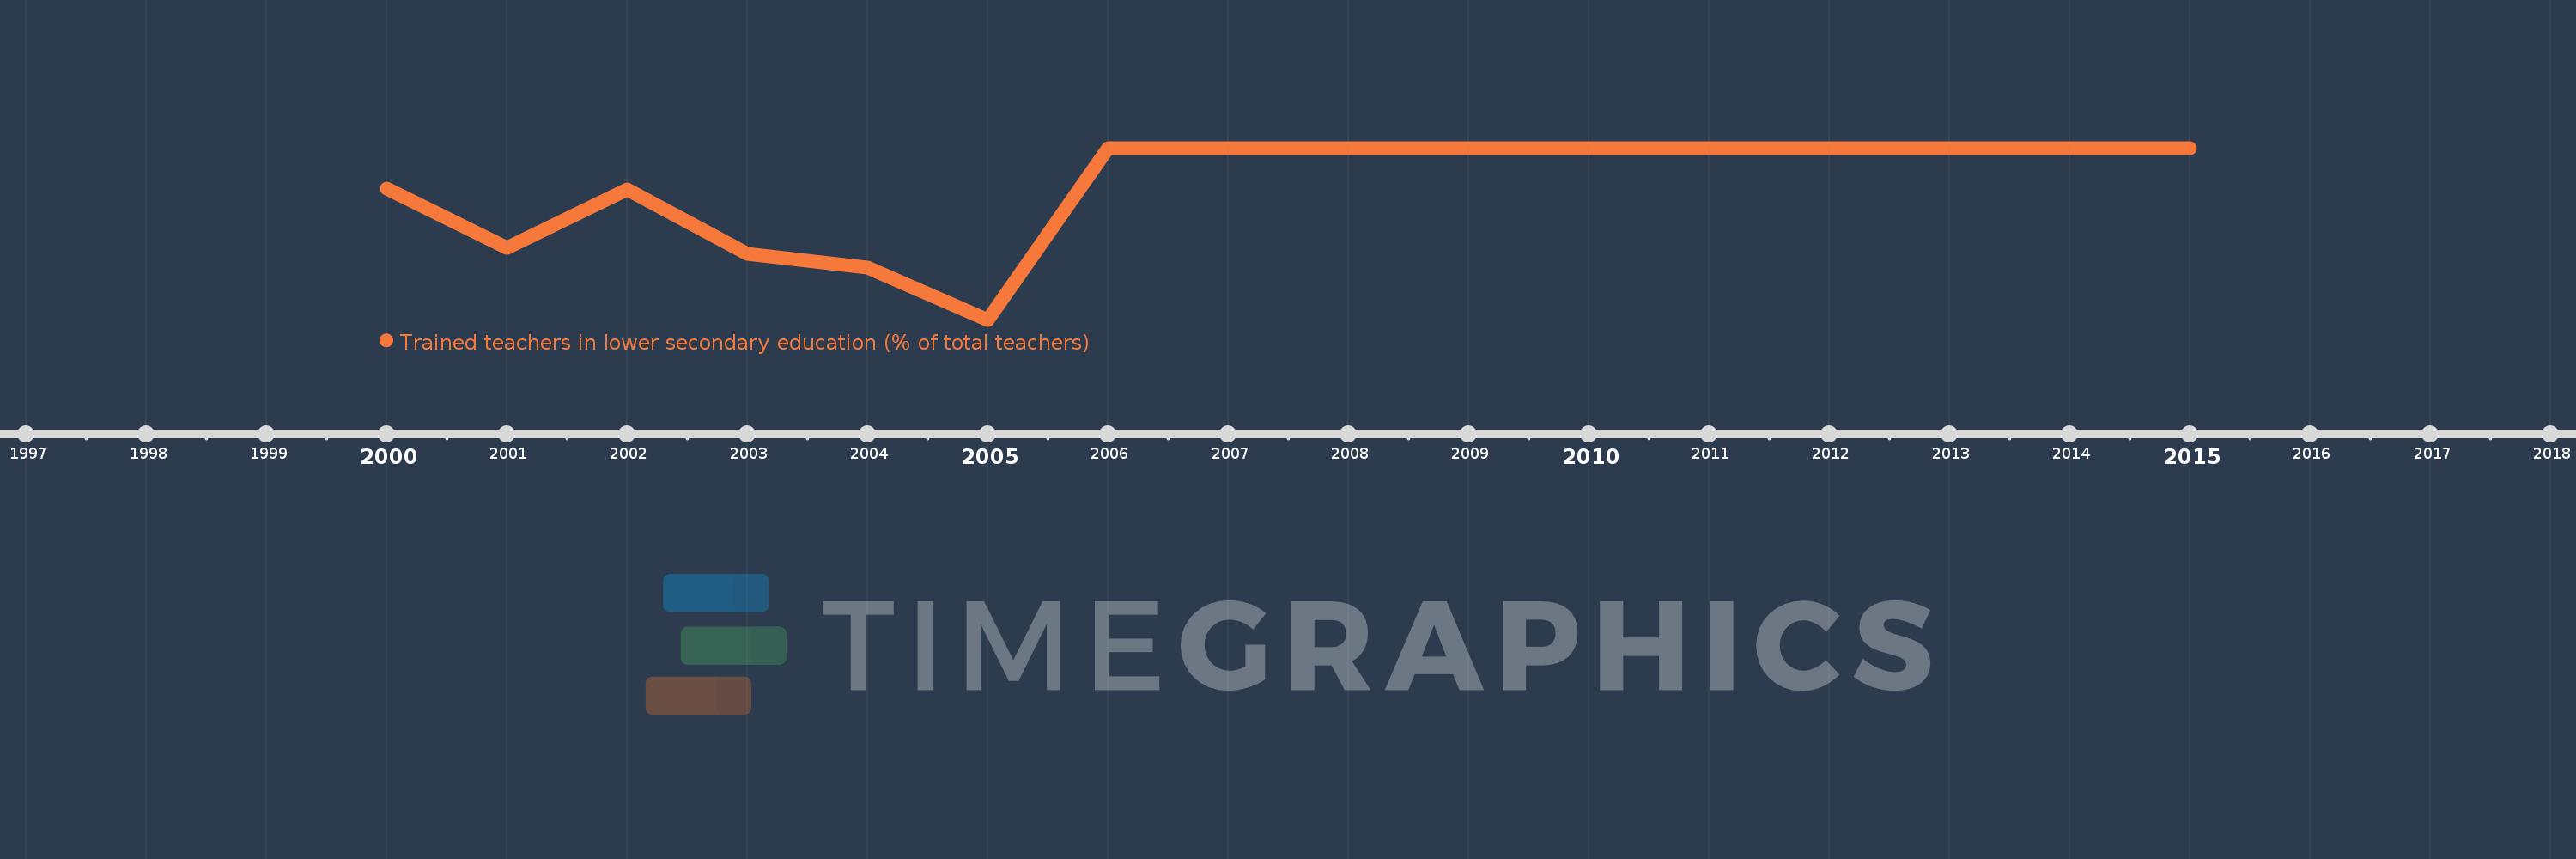
Questa scala temporale mostra un grafico dal 2000 anno al 2015 anno. Cuba. I dati fino ad 1999 anno non disponibili. Il numero di osservazioni attuali secondo i date: 16.
La fonte (nome):
Indicatori dello sviluppo mondiale
La fonte (organizzazione):
United Nations Educational, Scientific, and Cultural Organization (UNESCO) Institute for Statistics.
Categorie:
Education
sono stati aggiornati
23 apr 2017 anni
Indicatori delle variazioni dei valori per anni
In media:
95.148
Minima:
76.964
1 gen 2005 anni
Massimo:
100.0
1 gen 2006 anni
Alla data di osservazione
Valore
Variazione assoluta
La variazione rispetto al valore precedente
1 gen 2000 anni
94.56
+94.56
0.0%
1 gen 2001 anni
86.641
-7.919
-8.37%
1 gen 2002 anni
94.472
+7.831
9.04%
1 gen 2003 anni
85.779
-8.693
-9.2%
1 gen 2004 anni
83.955
-1.824
-2.13%
1 gen 2005 anni
76.964
-6.99
-8.33%
1 gen 2006 anni
100.0
+23.036
29.93%
1 gen 2007 anni
100.0
0.0
0.0%
1 gen 2008 anni
100.0
0.0
0.0%
1 gen 2009 anni
100.0
0.0
0.0%
1 gen 2010 anni
100.0
0.0
0.0%
1 gen 2011 anni
100.0
0.0
0.0%
1 gen 2012 anni
100.0
0.0
0.0%
1 gen 2013 anni
100.0
0.0
0.0%
1 gen 2014 anni
100.0
0.0
0.0%
1 gen 2015 anni
100.0
0.0
0.0%
Classificazione dei paesi secondo i statistiche attuali per anni