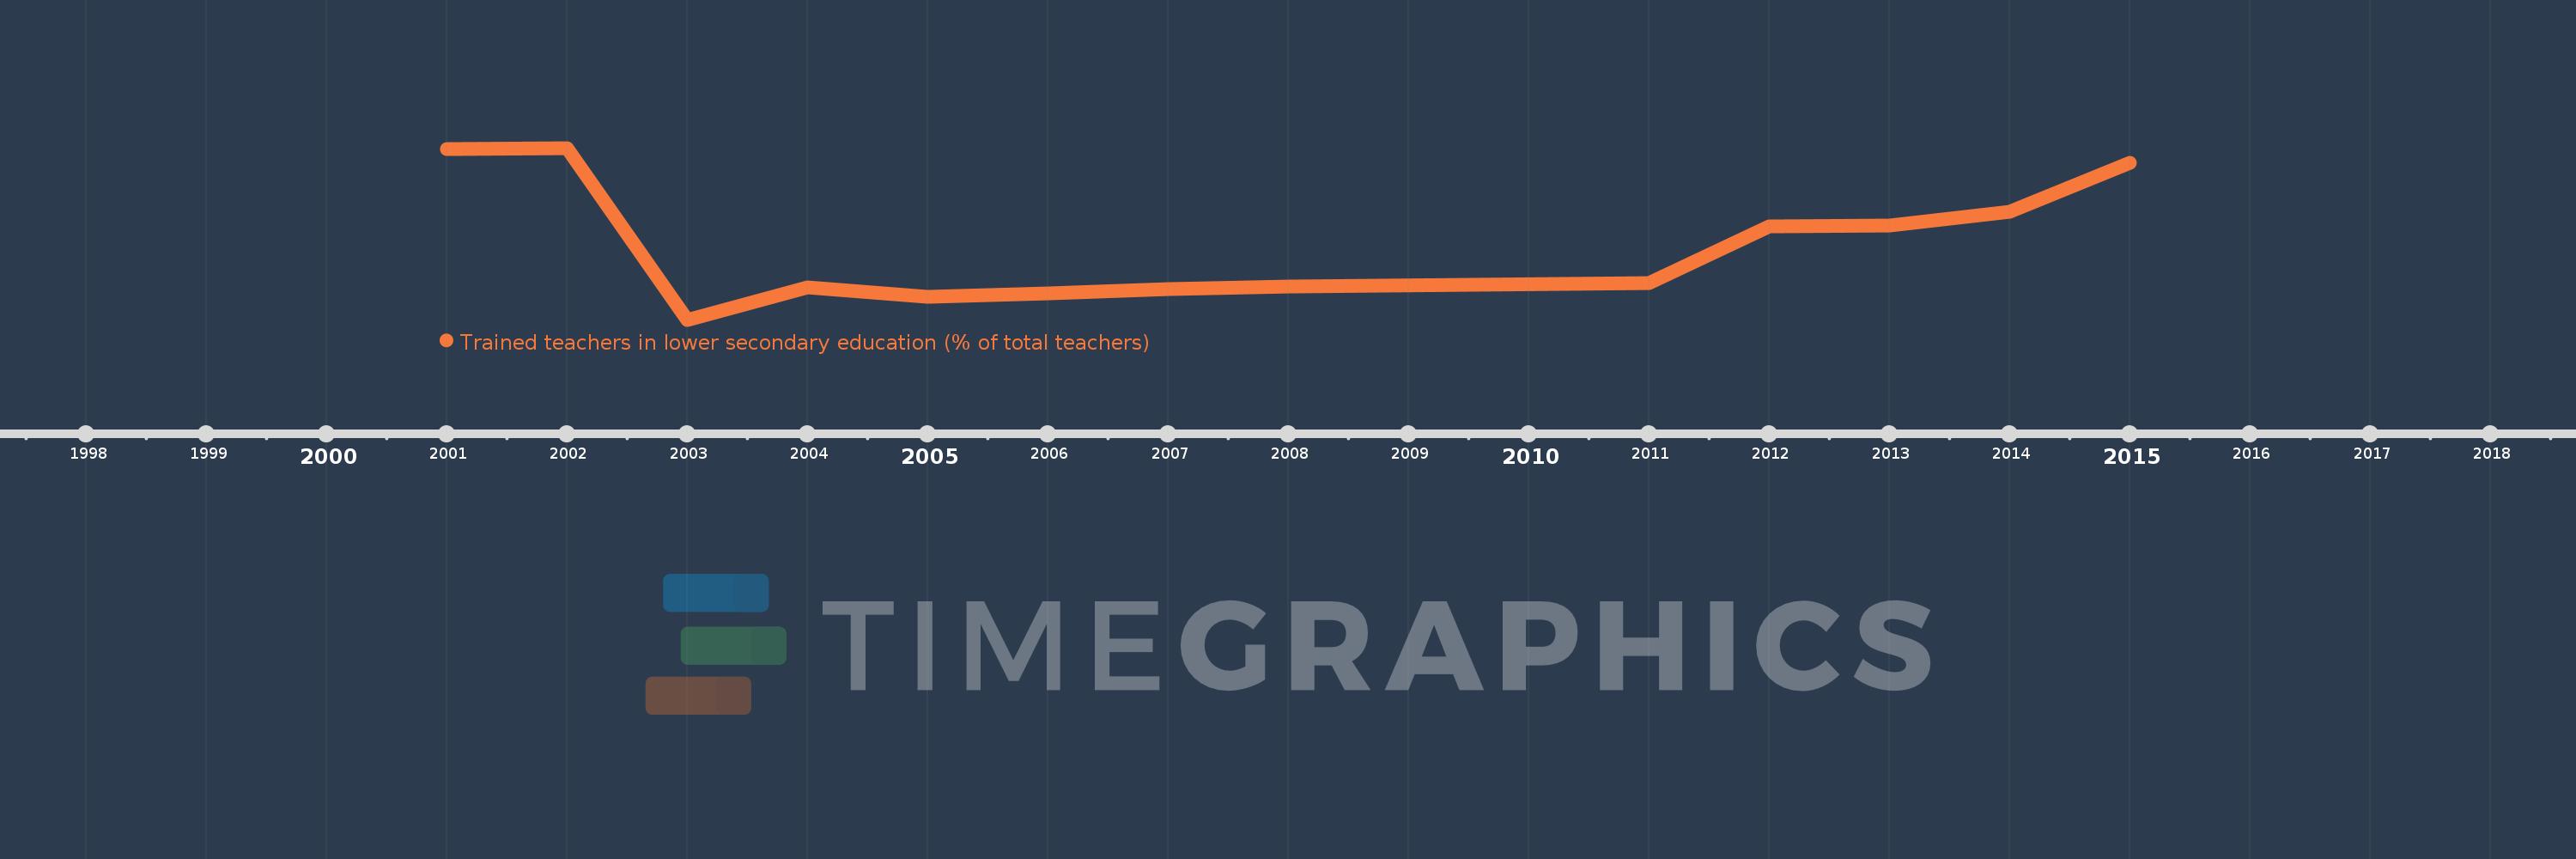
Questa scala temporale mostra un grafico dal 2001 anno al 2015 anno. Ecuador. I dati fino ad 2000 anno non disponibili. Il numero di osservazioni attuali secondo i date: 13.
La fonte (nome):
Indicatori dello sviluppo mondiale
La fonte (organizzazione):
United Nations Educational, Scientific, and Cultural Organization (UNESCO) Institute for Statistics.
Categorie:
Education
sono stati aggiornati
23 apr 2017 anni
Indicatori delle variazioni dei valori per anni
In media:
74.231
Minima:
67.692
1 gen 2003 anni
Massimo:
82.649
1 gen 2002 anni
Alla data di osservazione
Valore
Variazione assoluta
La variazione rispetto al valore precedente
1 gen 2001 anni
82.543
+82.543
0.0%
1 gen 2002 anni
82.649
+0.107
0.13%
1 gen 2003 anni
67.692
-14.957
-18.1%
1 gen 2004 anni
70.489
+2.797
4.13%
1 gen 2005 anni
69.683
-0.806
-1.14%
1 gen 2006 anni
69.954
+0.271
0.39%
1 gen 2007 anni
70.334
+0.38
0.54%
1 gen 2008 anni
70.61
+0.276
0.39%
1 gen 2011 anni
70.889
+0.279
0.4%
1 gen 2012 anni
75.794
+4.905
6.92%
1 gen 2013 anni
75.917
+0.122
0.16%
1 gen 2014 anni
77.081
+1.164
1.53%
1 gen 2015 anni
81.373
+4.292
5.57%
Classificazione dei paesi secondo i statistiche attuali per anni