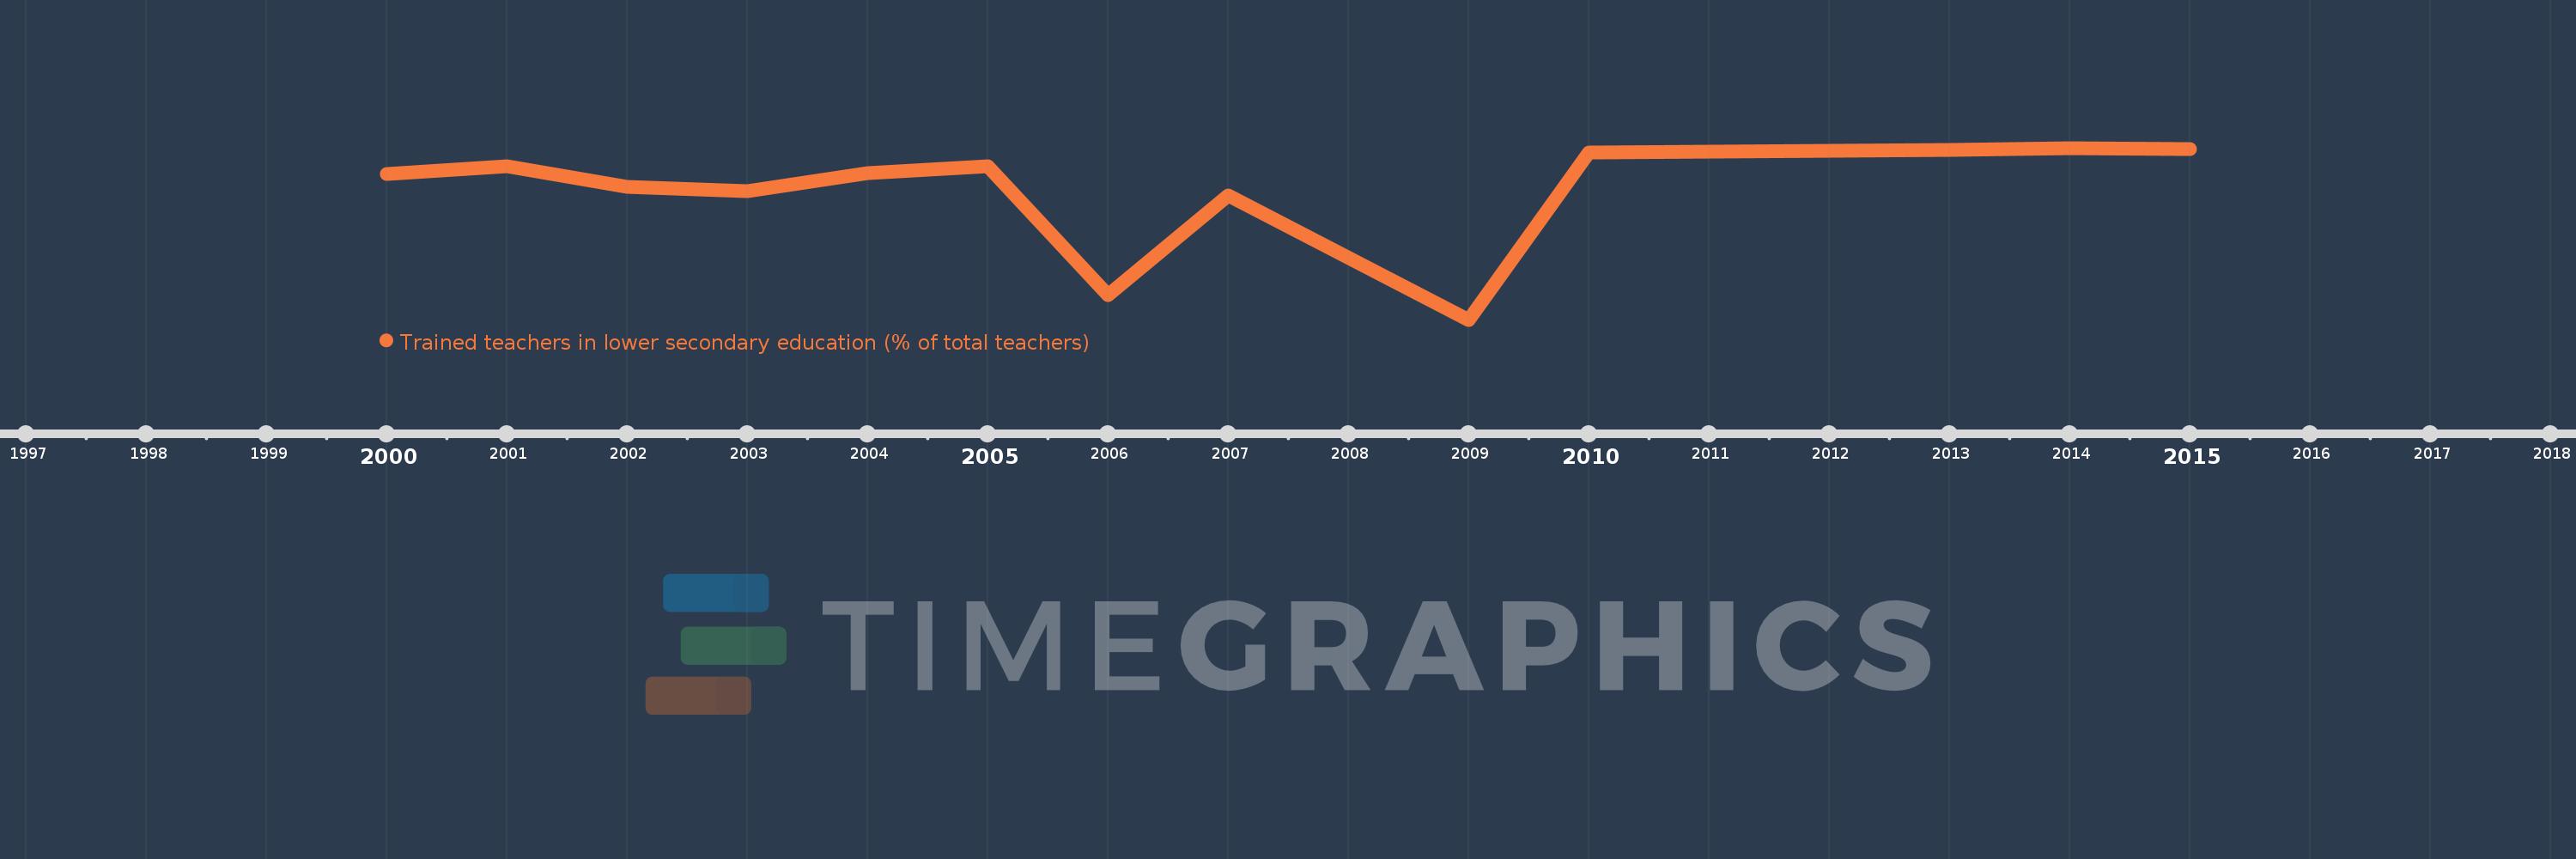
Questa scala temporale mostra un grafico dal 2000 anno al 2015 anno. Lao PDR. I dati fino ad 1999 anno non disponibili. Il numero di osservazioni attuali secondo i date: 15.
La fonte (nome):
Indicatori dello sviluppo mondiale
La fonte (organizzazione):
United Nations Educational, Scientific, and Cultural Organization (UNESCO) Institute for Statistics.
Categorie:
Education
sono stati aggiornati
23 apr 2017 anni
Indicatori delle variazioni dei valori per anni
In media:
97.444
Minima:
89.584
1 gen 2009 anni
Massimo:
99.586
1 gen 2014 anni
Alla data di osservazione
Valore
Variazione assoluta
La variazione rispetto al valore precedente
1 gen 2000 anni
98.054
+98.054
0.0%
1 gen 2001 anni
98.518
+0.464
0.47%
1 gen 2002 anni
97.329
-1.189
-1.21%
1 gen 2003 anni
97.048
-0.281
-0.29%
1 gen 2004 anni
98.12
+1.072
1.1%
1 gen 2005 anni
98.515
+0.395
0.4%
1 gen 2006 anni
91.04
-7.476
-7.59%
1 gen 2007 anni
96.8
+5.76
6.33%
1 gen 2009 anni
89.584
-7.216
-7.45%
1 gen 2010 anni
99.332
+9.748
10.88%
1 gen 2011 anni
99.347
+0.015
0.02%
1 gen 2012 anni
99.404
+0.057
0.06%
1 gen 2013 anni
99.474
+0.07
0.07%
1 gen 2014 anni
99.586
+0.112
0.11%
1 gen 2015 anni
99.503
-0.083
-0.08%
Classificazione dei paesi secondo i statistiche attuali per anni