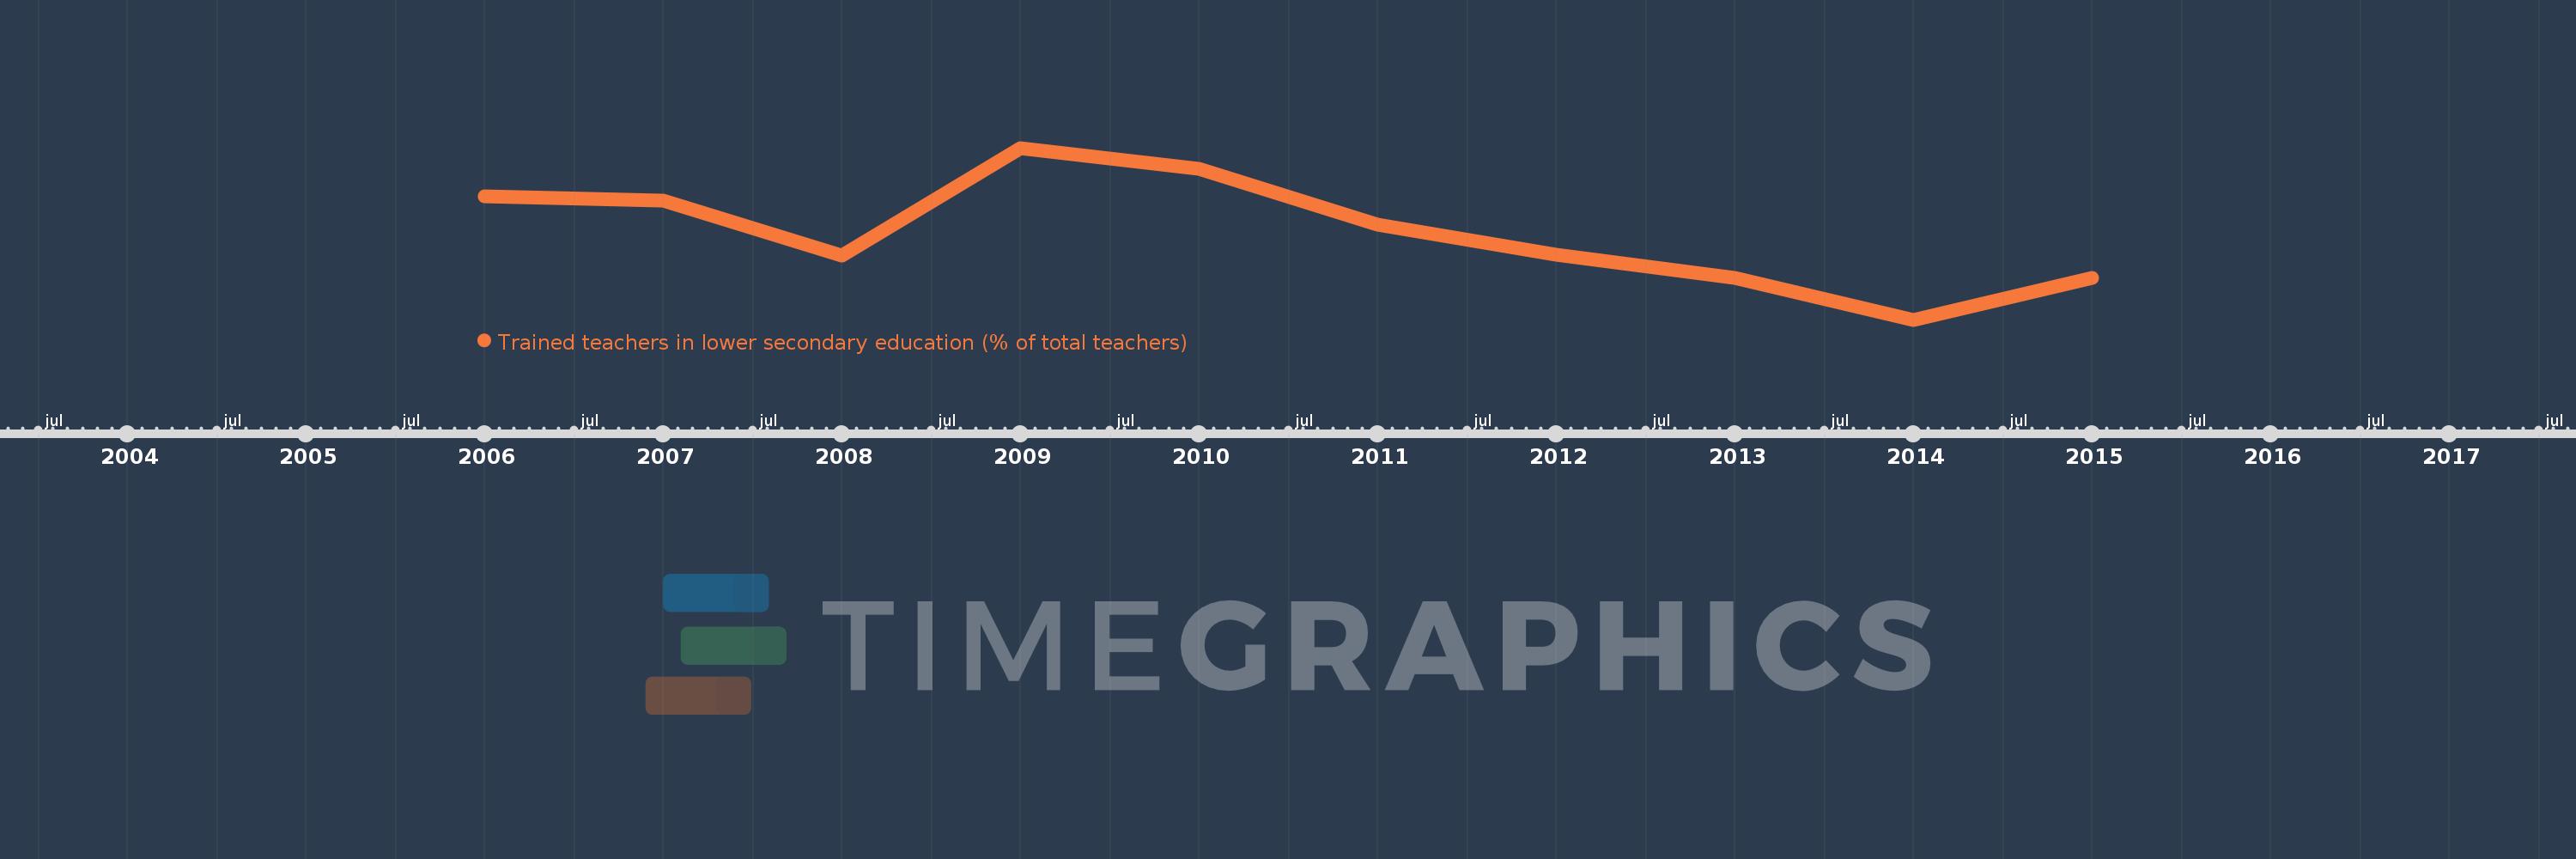
Questa scala temporale mostra un grafico dal 2006 anno al 2015 anno. IDA blend. I dati fino ad 2005 anno non disponibili. Il numero di osservazioni attuali secondo i date: 10.
La fonte (nome):
Indicatori dello sviluppo mondiale
La fonte (organizzazione):
United Nations Educational, Scientific, and Cultural Organization (UNESCO) Institute for Statistics.
Categorie:
Education
sono stati aggiornati
23 apr 2017 anni
Indicatori delle variazioni dei valori per anni
In media:
84.444
Minima:
79.277
1 gen 2014 anni
Massimo:
89.449
1 gen 2009 anni
Alla data di osservazione
Valore
Variazione assoluta
La variazione rispetto al valore precedente
1 gen 2006 anni
86.576
+86.576
0.0%
1 gen 2007 anni
86.33
-0.246
-0.28%
1 gen 2008 anni
83.054
-3.276
-3.79%
1 gen 2009 anni
89.449
+6.395
7.7%
1 gen 2010 anni
88.237
-1.213
-1.36%
1 gen 2011 anni
84.893
-3.343
-3.79%
1 gen 2012 anni
83.133
-1.76
-2.07%
1 gen 2013 anni
81.757
-1.375
-1.65%
1 gen 2014 anni
79.277
-2.481
-3.03%
1 gen 2015 anni
81.732
+2.455
3.1%
Classificazione dei paesi secondo i statistiche attuali per anni