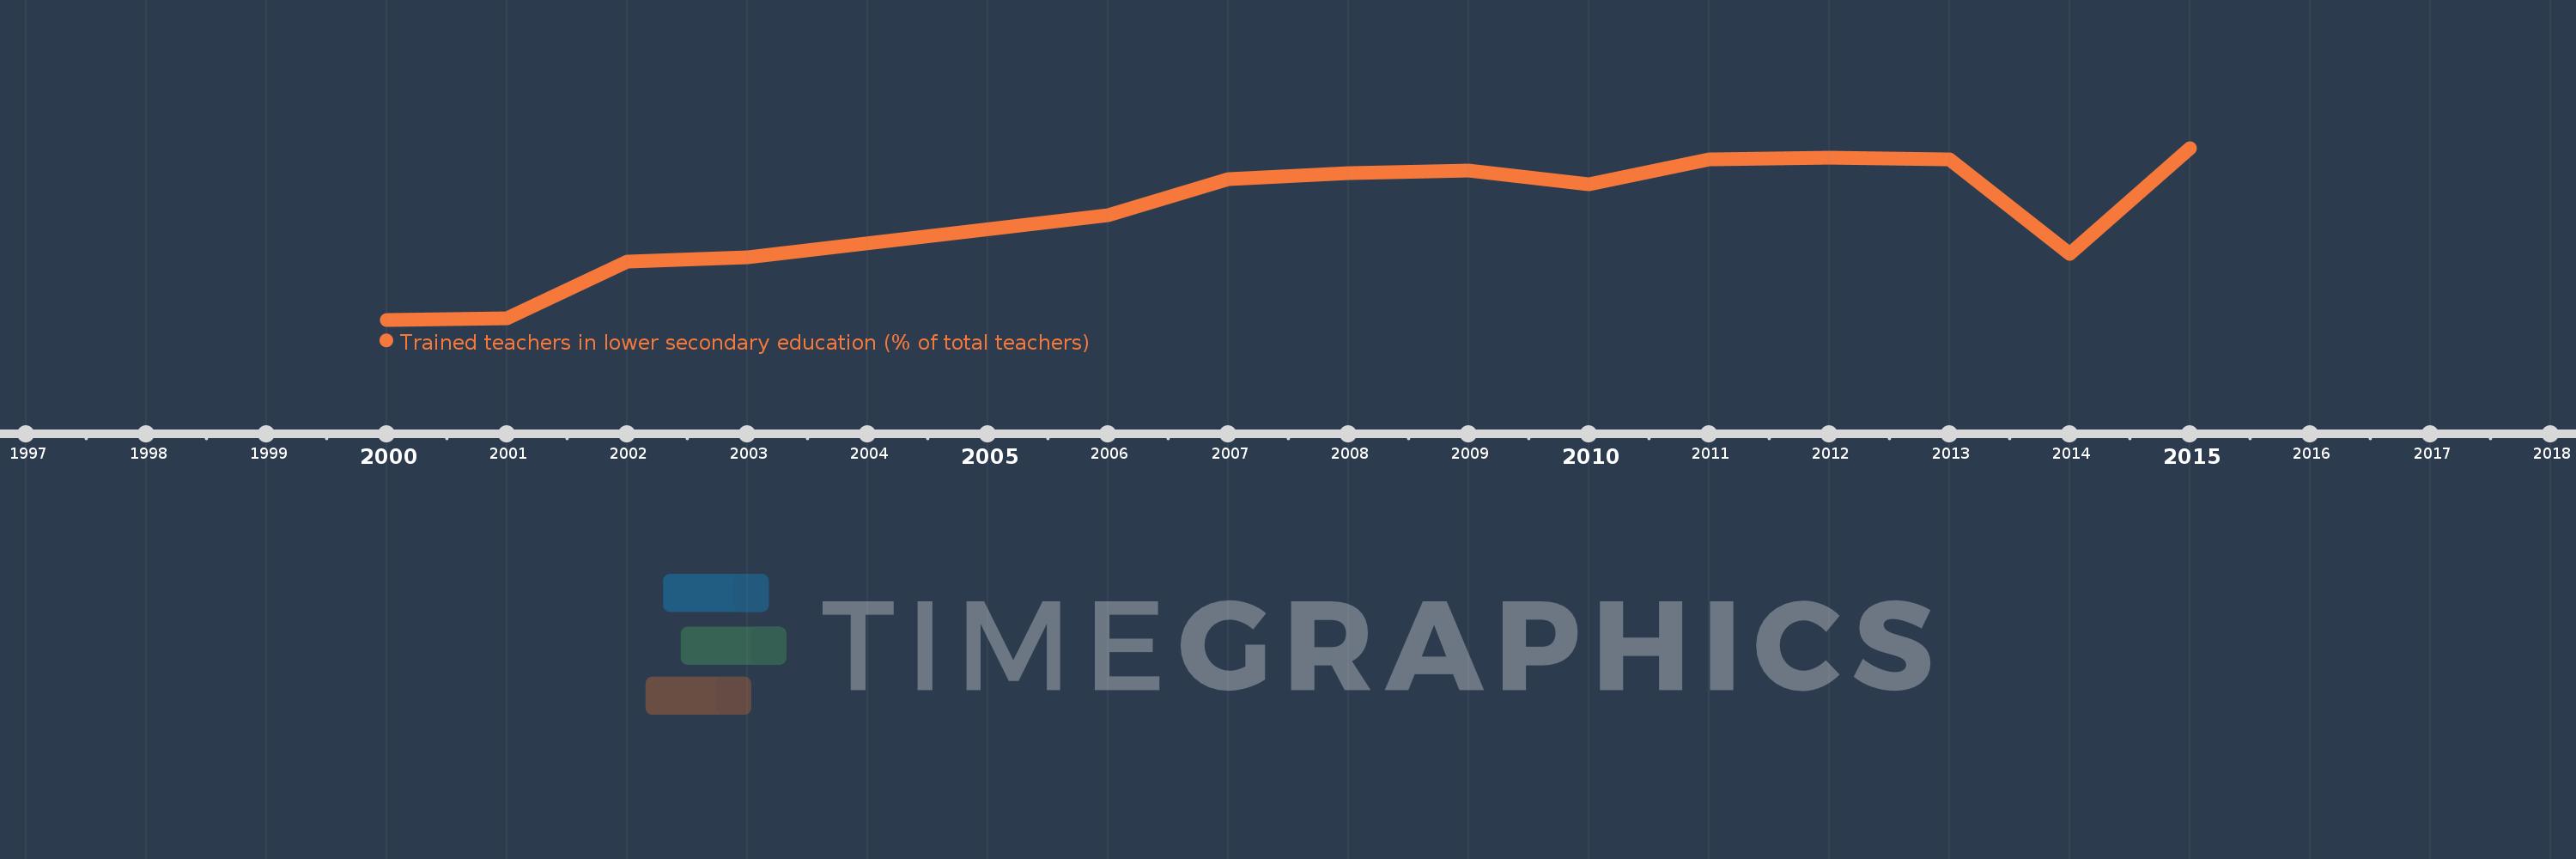
Questa scala temporale mostra un grafico dal 2000 anno al 2015 anno. Vietnam. I dati fino ad 1999 anno non disponibili. Il numero di osservazioni attuali secondo i date: 14.
La fonte (nome):
Indicatori dello sviluppo mondiale
La fonte (organizzazione):
United Nations Educational, Scientific, and Cultural Organization (UNESCO) Institute for Statistics.
Categorie:
Education
sono stati aggiornati
23 apr 2017 anni
Indicatori delle variazioni dei valori per anni
In media:
94.907
Minima:
86.19
1 gen 2000 anni
Massimo:
100.0
1 gen 2015 anni
Alla data di osservazione
Valore
Variazione assoluta
La variazione rispetto al valore precedente
1 gen 2000 anni
86.19
+86.19
0.0%
1 gen 2001 anni
86.318
+0.128
0.15%
1 gen 2002 anni
90.84
+4.522
5.24%
1 gen 2003 anni
91.193
+0.353
0.39%
1 gen 2006 anni
94.59
+3.397
3.72%
1 gen 2007 anni
97.466
+2.876
3.04%
1 gen 2008 anni
97.989
+0.523
0.54%
1 gen 2009 anni
98.2
+0.211
0.22%
1 gen 2010 anni
97.082
-1.118
-1.14%
1 gen 2011 anni
99.064
+1.982
2.04%
1 gen 2012 anni
99.235
+0.17
0.17%
1 gen 2013 anni
99.077
-0.158
-0.16%
1 gen 2014 anni
91.454
-7.623
-7.69%
1 gen 2015 anni
100.0
+8.546
9.34%
Classificazione dei paesi secondo i statistiche attuali per anni